Add startup time metrics #27878
Add startup time metrics #27878
Conversation
| return; | ||
| } | ||
| TimeGauge | ||
| .builder("spring.boot.application.started", () -> event.getStartupTime().toMillis(), |
There was a problem hiding this comment.
@mbazos I know you had mentioned the following possible metric candidates for a StartupTimeMetrics.
- jvm start time
- application start time
- spring context start time
spring context start time
Just to clarify that the StartupInfoLogger is actually logging "spring context start time" which corresponds to the ApplicationStartedEvent (the app is live but not ready for requests yet - it still has to invoke any runners). This pull request logs this startup time.
application start time
The "application start time" I am guessing would correspond to the ApplicationReadyEvent (the app is live and the app is ready for requests - all runners have been invoked). This pull request does not log this startup time. It could easily be added though and it would allow users to get an idea how much their runners are adding to startup time.
jvm start time
The StartupInfoLogger is logging "jvm uptime" which corresponds to how many ms the JVM has been up. This could also give an idea of the contribution the JVM has on the startup time. This pull request does not log this startup time either but it could easily be added.
@wilkinsona @mbazos
Wdyt about me adding in the 2 above metrics?
|
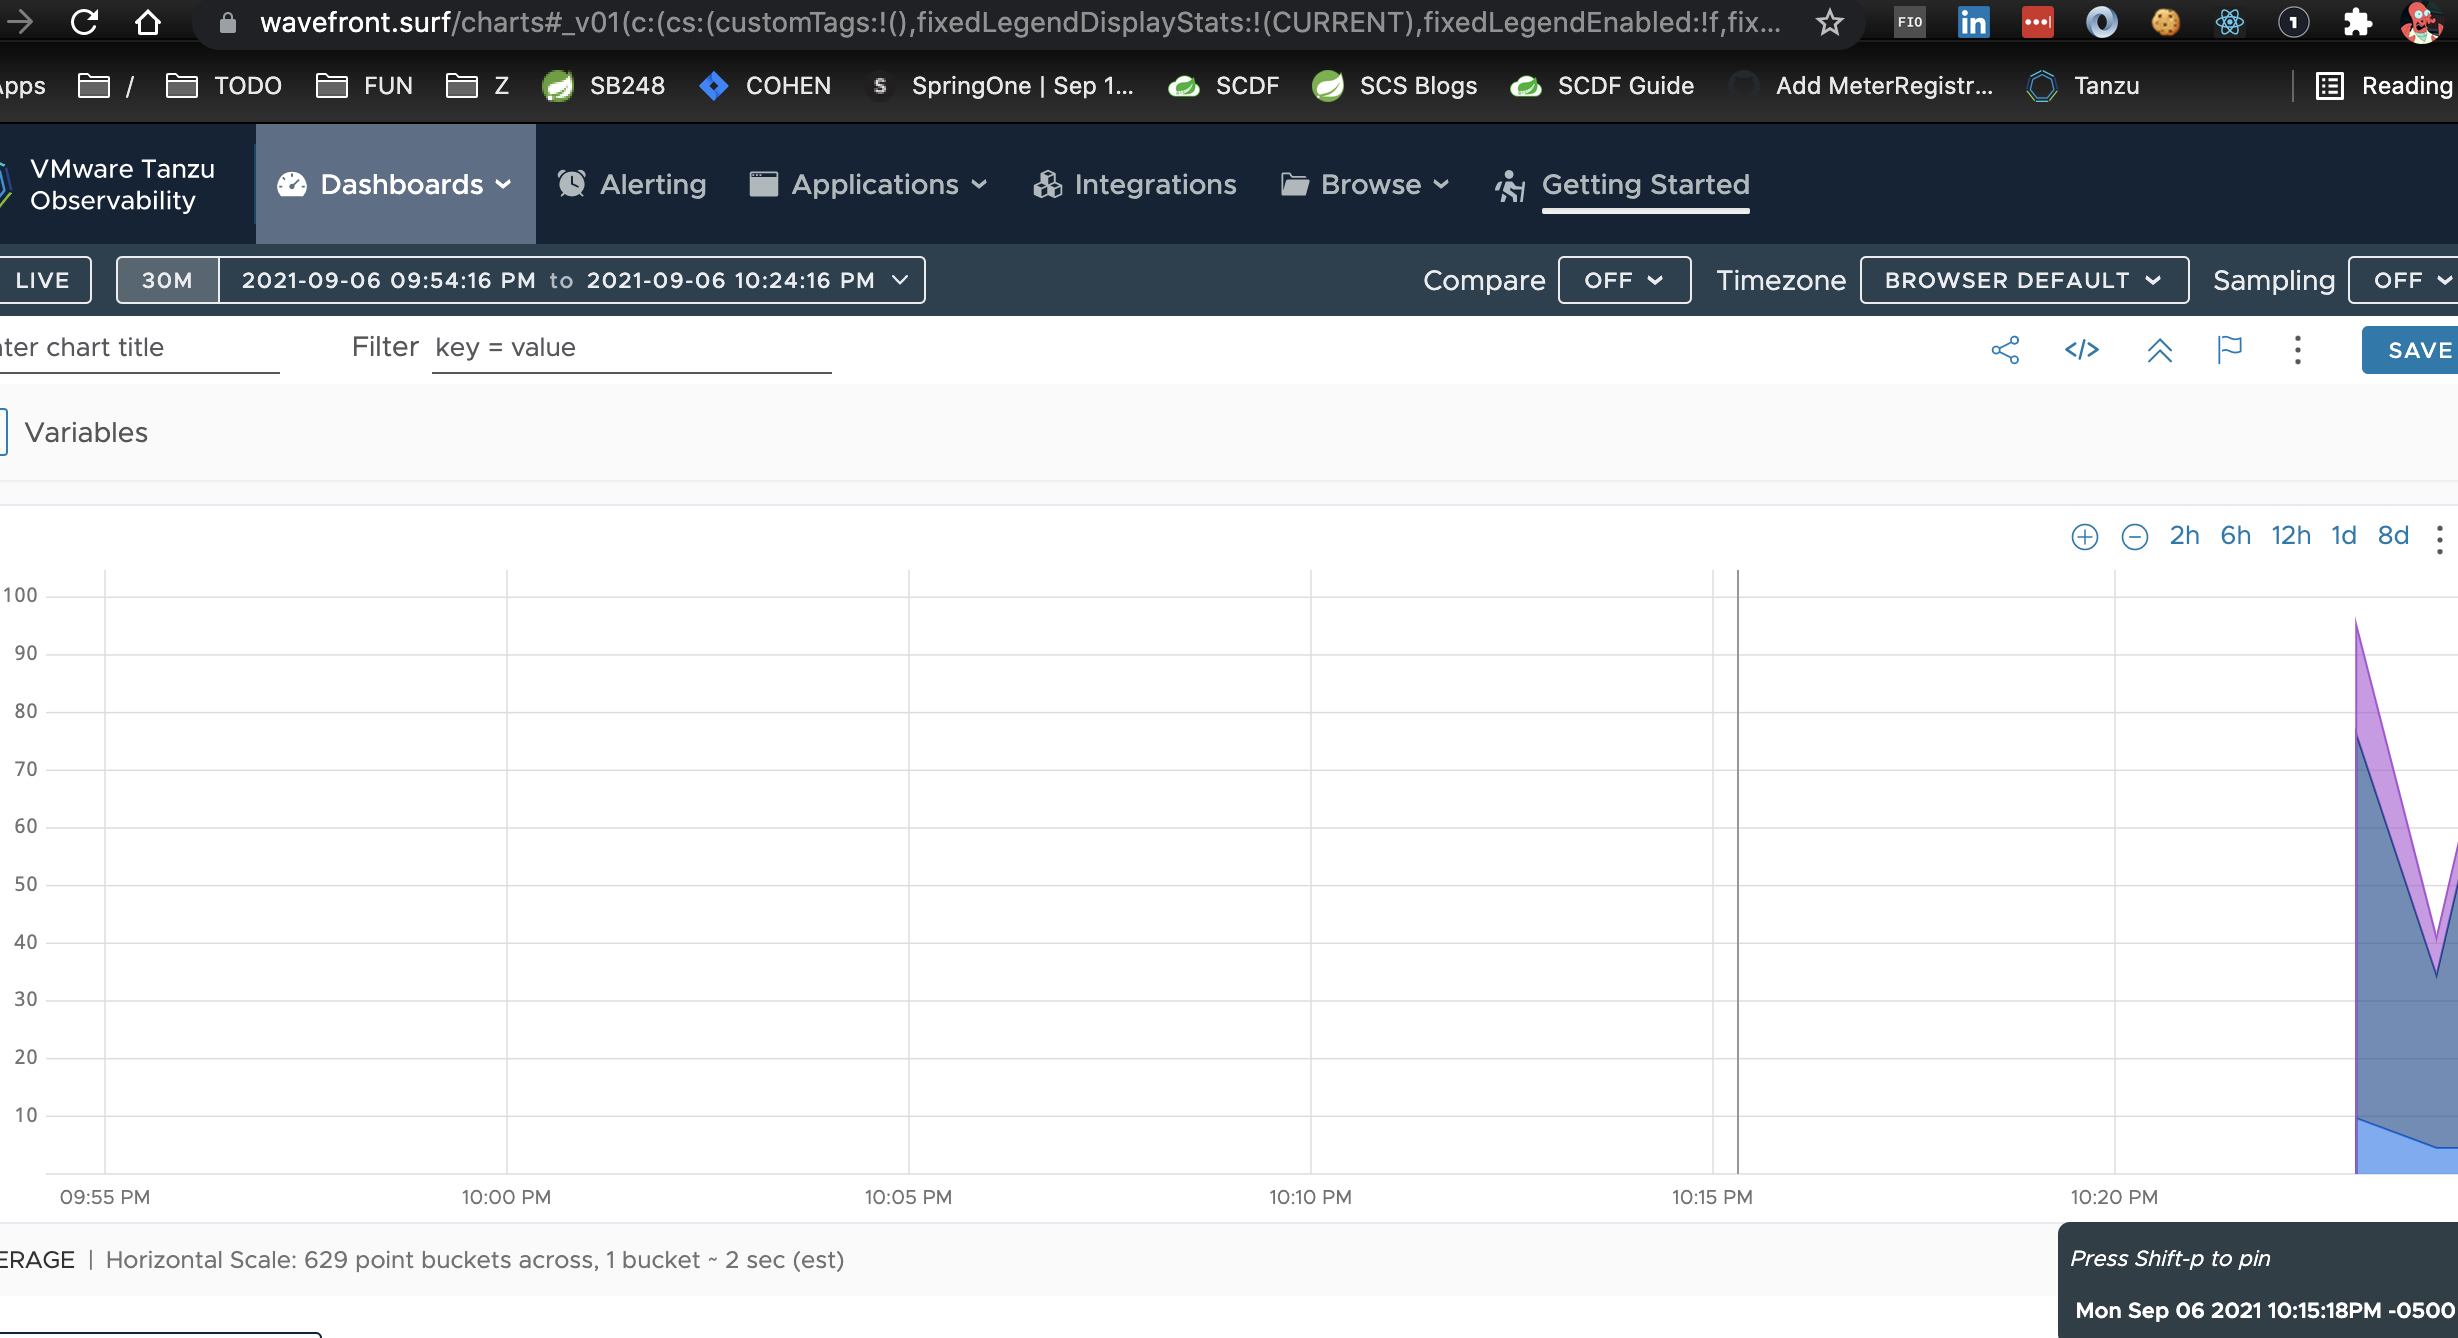
I added the startup time to the ApplicationReadyEvent as well. You can tell by the graph below which portion of the startup time is due to the runners (I think its helpful). I am waiting to push that 2nd commit though until I get a nod on adding the metric.
|
|
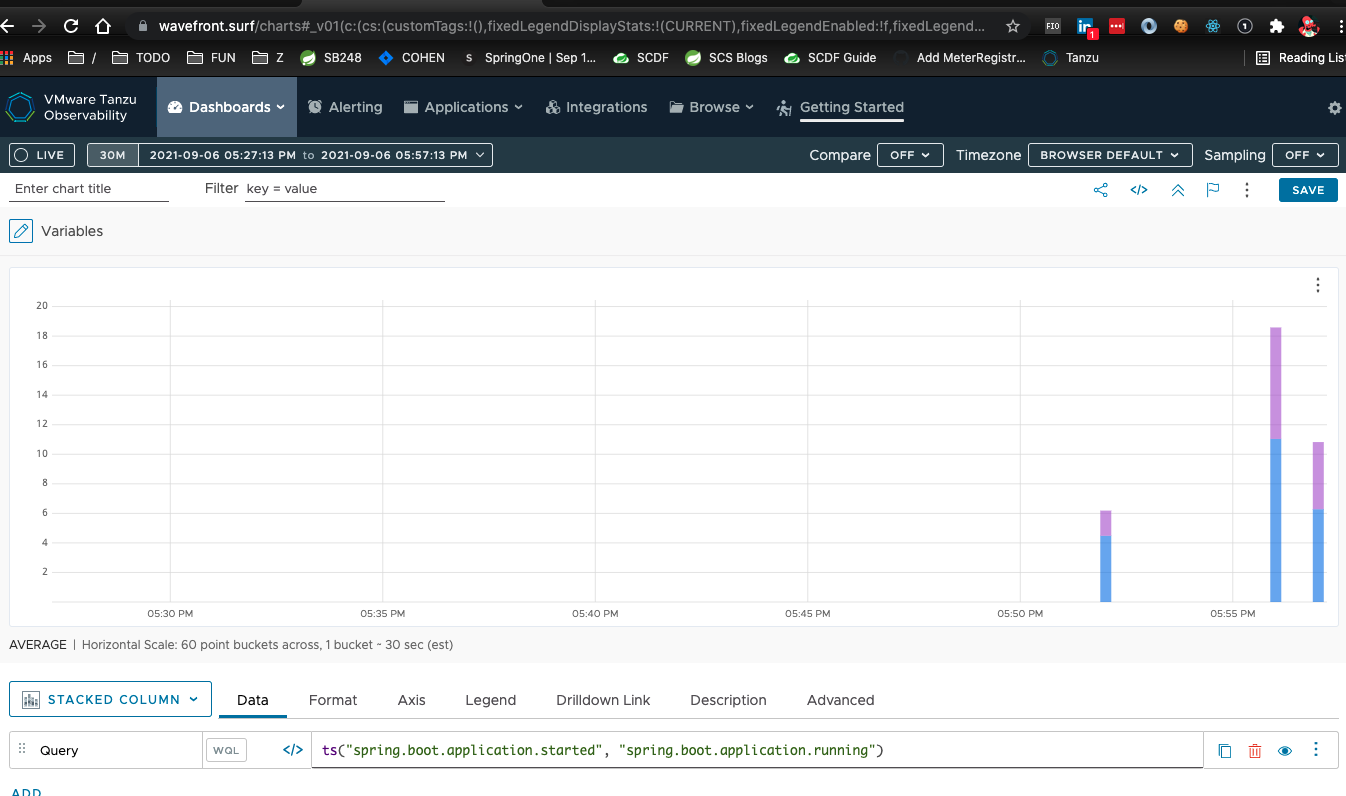
I went ahead and pushes the subsequent commits that add the times for application.running and the jvm uptime as the point that the application is in ready state. Looks like this in WF...
|
| refreshContext(context); | ||
| afterRefresh(context, applicationArguments); | ||
| stopWatch.stop(); | ||
| stopWatch.start("applicationReady"); |
There was a problem hiding this comment.
I think this should be moved to past the listeners.started call
There was a problem hiding this comment.
So the application.ready.time is the total time from the app run() to the end of the runners and not just the portion of time that the runners took. I will give an example to make sure we are on the same page:
| hh:mm:ss | step |
|---|---|
| 00:00:00 | jvm is started |
| 00:00:04 | run is invoked |
| 00:00:08 | context has been refreshed |
| 00:00:12 | runners done executing |
The "base T0" time from the app perspective is 00:00:04. Which gives the following:
application.started.time: 4s (00:00:04 -> 00:00:08)application.ready.time: 8s (00:00:04 -> 00:00:12)application.ready.jvm.time: 12s (00:00:00 -> 00:00:12)
Is that what you were thinking as well?
|
Thanks very much for the PR @Bono007. We discussed some aspects of this today on our call and we think that the timer names should be changed from: to: We're also wondering if there should be configuration options to change them. Do you have any time to update the PR in that direction? If not, we can handle it when we merge. |
My pleasure @philwebb
I ❤️ these new names - they were too verbose and in lockstep w/ the application event names. I went back and forth and just submitted these in hopes that I would get some feedback from team (I meant to call this out in comment). Ugghh naming... :) One follow up question though,
I have went back/forth on the ability to change metric names (in general, not just here) and one hand its great because it allows consumers to name the metrics what they want for their custom requirements. On the other hand, it allows consumers to name the metrics what they want. This can lead to a somewhat standard metric name such as "mongodb.driver.commands" now being called "acme.company.mongodb.driver.or.whatever". I know the instrumentation in Micrometer tends to stay on the hardcoded side. I notice that SpringBoot has started to allow customization of most of the meters. I am ok w/ either approach but just wanted to bring this up.
Absolutely. On it now. |
….started.[ready|ready.jvm].time`
.../src/main/java/org/springframework/boot/actuate/autoconfigure/metrics/MetricsProperties.java
Outdated
Show resolved
Hide resolved
...springframework/boot/actuate/autoconfigure/metrics/startup/StartupTimeMetricsProperties.java
Outdated
Show resolved
Hide resolved
...uator/src/main/java/org/springframework/boot/actuate/metrics/startup/StartupTimeMetrics.java
Outdated
Show resolved
Hide resolved
...uator/src/main/java/org/springframework/boot/actuate/metrics/startup/StartupTimeMetrics.java
Show resolved
Hide resolved
Ah, that reminds me of the other thing we discussed. We don't think this should be part of Spring Boot. Instead, it feels like a general JVM metric that could be provided my Micrometer. |
Yep, I agree w/ that. It was really added here as a convenience to see how much of the Spring Boot startup attributed to the overall JVM uptime (or vice-versa). The thing that Micrometer will not have is knowing that the application is ready (aka Spring event listener). There is already the Either way, I will push another commit that removes the JVM metric. |
|
Thanks again, Chris. |
Fixes gh-26729
@wilkinsona I picked your draft changes up and added the Actuator side of things.
TODO
Here is what the metric looks like in Wavefront.