scales 1.0.0 log_breaks makes for inferior visual test (numeric-log.svg) in ggplot2 #179
Description
While approving the changes to ggplot2's visual tests (tidyverse/ggplot2#2842), @hadley requested that we review the change in numeric-log.svg cause by the improved log_breaks() functionality introduced in scales 1.0.0
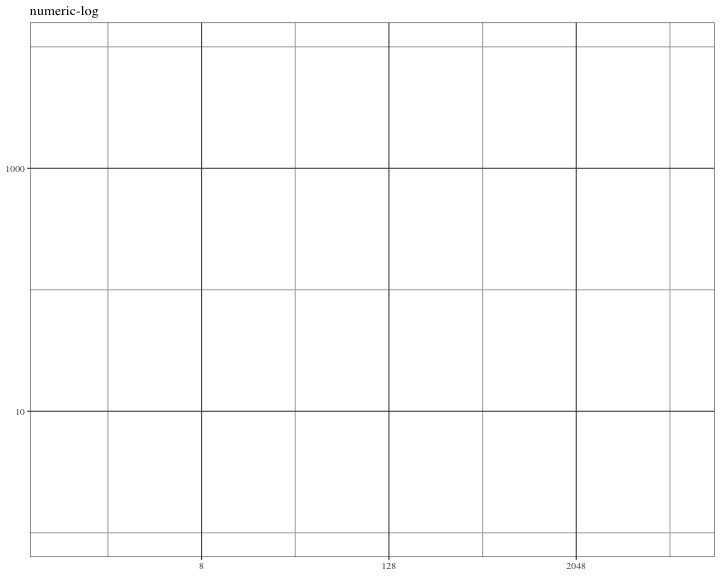
This was the plot rendered with scales 0.5.0:
This is the current plot with scales 1.0.0:
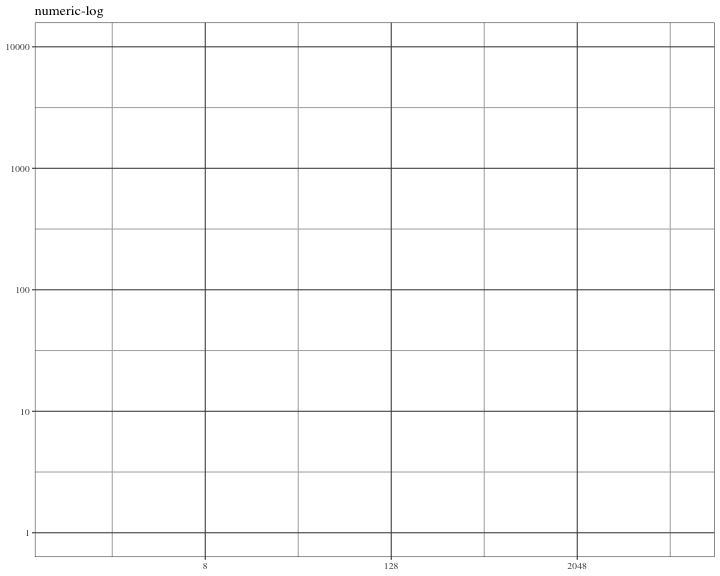
The scale is behaving as expected but the additional major tick lines does make for a visually busier grid, especially given the use of theme_test() by default.