scatter colorbar ignores boundaries when outside of plot #144
Description
Description
When using the plt.scatter wrapper, if some dimension of the data is mapped to color and the color bar placed externally, it is forced into a discrete colorbar and the boundaries cannot be modified. The colorbar features are different if placed inside the plot.
- It would be great for this to generally be fixed.
- Would it be feasible to add
levelsto the scatter wrapper?
Steps to reproduce
import numpy as np
import proplot as plot

state = np.random.RandomState(51423)
data = state.rand(2, 100)

f, ax = plot.subplots()
ax.scatter(*data, marker='o', color=data.sum(axis=0), cmap='Marine',
           colorbar='l', vmin=0, vmax=2,
           colorbar_kw={'boundaries': plot.arange(0, 2, 0.01),
                                  'locator': 0.5})

f, ax = plot.subplots()
ax.scatter(*data, marker='o', color=data.sum(axis=0), cmap='Marine',
           colorbar='lr', vmin=0, vmax=2,
           colorbar_kw={'boundaries': plot.arange(0, 2, 0.01),
                                  'locator': 0.5})
In the first bit, I am using boundaries as a hack to get at levels. I want to force this to much smaller colorbar steps, just to prove that it's working. It seems like locator works, but not boundaries for instance.
In the second bit, when colorbar='lr', it works fine. I.e., when colorbars are inside the plot, the boundaries keyword works. When placed outside (e.g. l, r, b), the colorbar is funky.

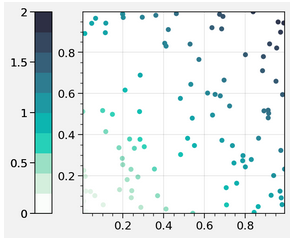
Equivalent steps in matplotlib
The default exterior colorbar in matplotlib looks a lot better (it's continuous without mislabeling of the discrete boundaries), and the boundaries keyword works here.
import matplotlib.pyplot as plt
state = np.random.RandomState(51423)
data = state.rand(2, 100)


f, ax = plt.subplots()
p = ax.scatter(*data, marker='o', c=data.sum(axis=0))

f.colorbar(p, boundaries=plot.arange(0, 2, 0.1))
Proplot version
0.5.0.post46