streamparticles() not working correctly #307
Description
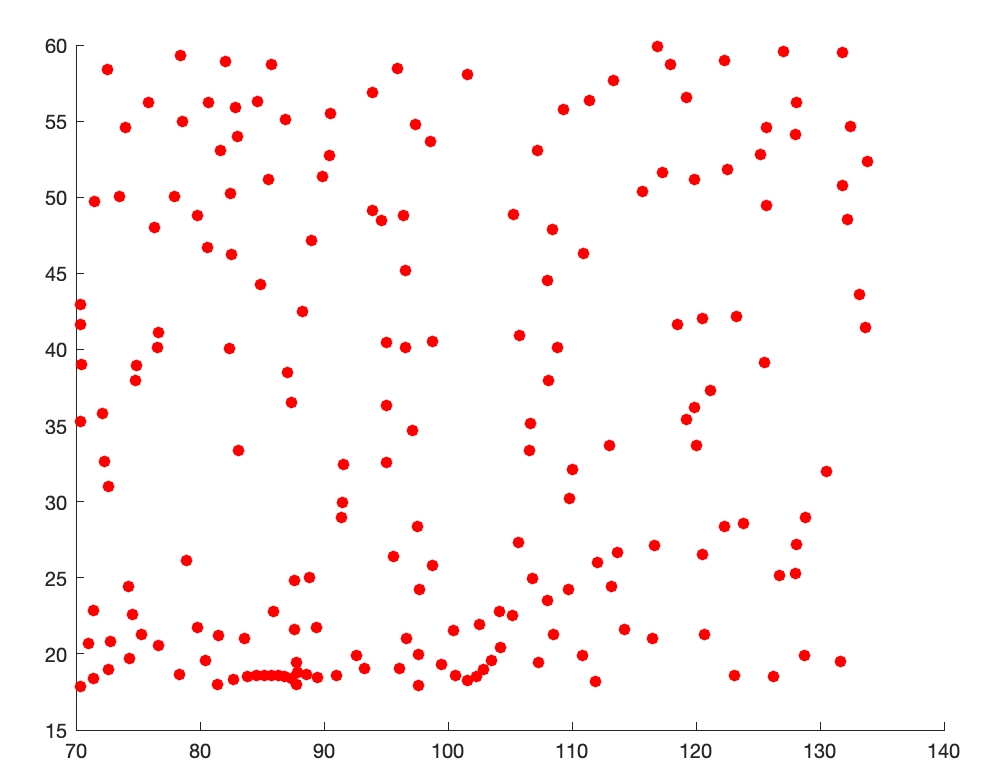
When using streamparticles() to draw stream particles of a vector field, the particles are plotted as a 3-D scatter chart.
load wind
[verts,averts] = streamslice(x,y,z,u,v,w,[],[],5);
iverts = interpstreamspeed(x,y,z,u,v,w,verts,.05);
streamparticles(iverts, 200)

fig2plotly(gcf, 'offline', false);
Expected and generated (https://chart-studio.plotly.com/~xarico10/1009/#/) plots:

Examples on using streamparticles() can be found on:
https://www.mathworks.com/help/matlab/ref/streamparticles.html