Skip to content

pie3() rendering problems #199

New issue

Have a question about this project? Sign up for a free GitHub account to open an issue and contact its maintainers and the community.

By clicking “Sign up for GitHub”, you agree to our terms of service and privacy statement. We’ll occasionally send you account related emails.

Already on GitHub? Sign in to your account

Closed
xarico10 opened this issue Jul 27, 2021 · 1 comment
Closed

pie3() rendering problems #199

xarico10 opened this issue Jul 27, 2021 · 1 comment
Assignees

Comments

@xarico10
Copy link
Contributor

When using pie3() to plot a 3-D pie chart, huge rendering and visual issues are happening.

x = [1,3,0.5,2.5,2];
figure
pie3(x)

Expected and generated (https://chart-studio.plotly.com/~xarico10/511/#/) plots:
Captura de Pantalla 2021-07-26 a la(s) 11 35 16 p  m
Captura de Pantalla 2021-07-26 a la(s) 11 35 47 p  m

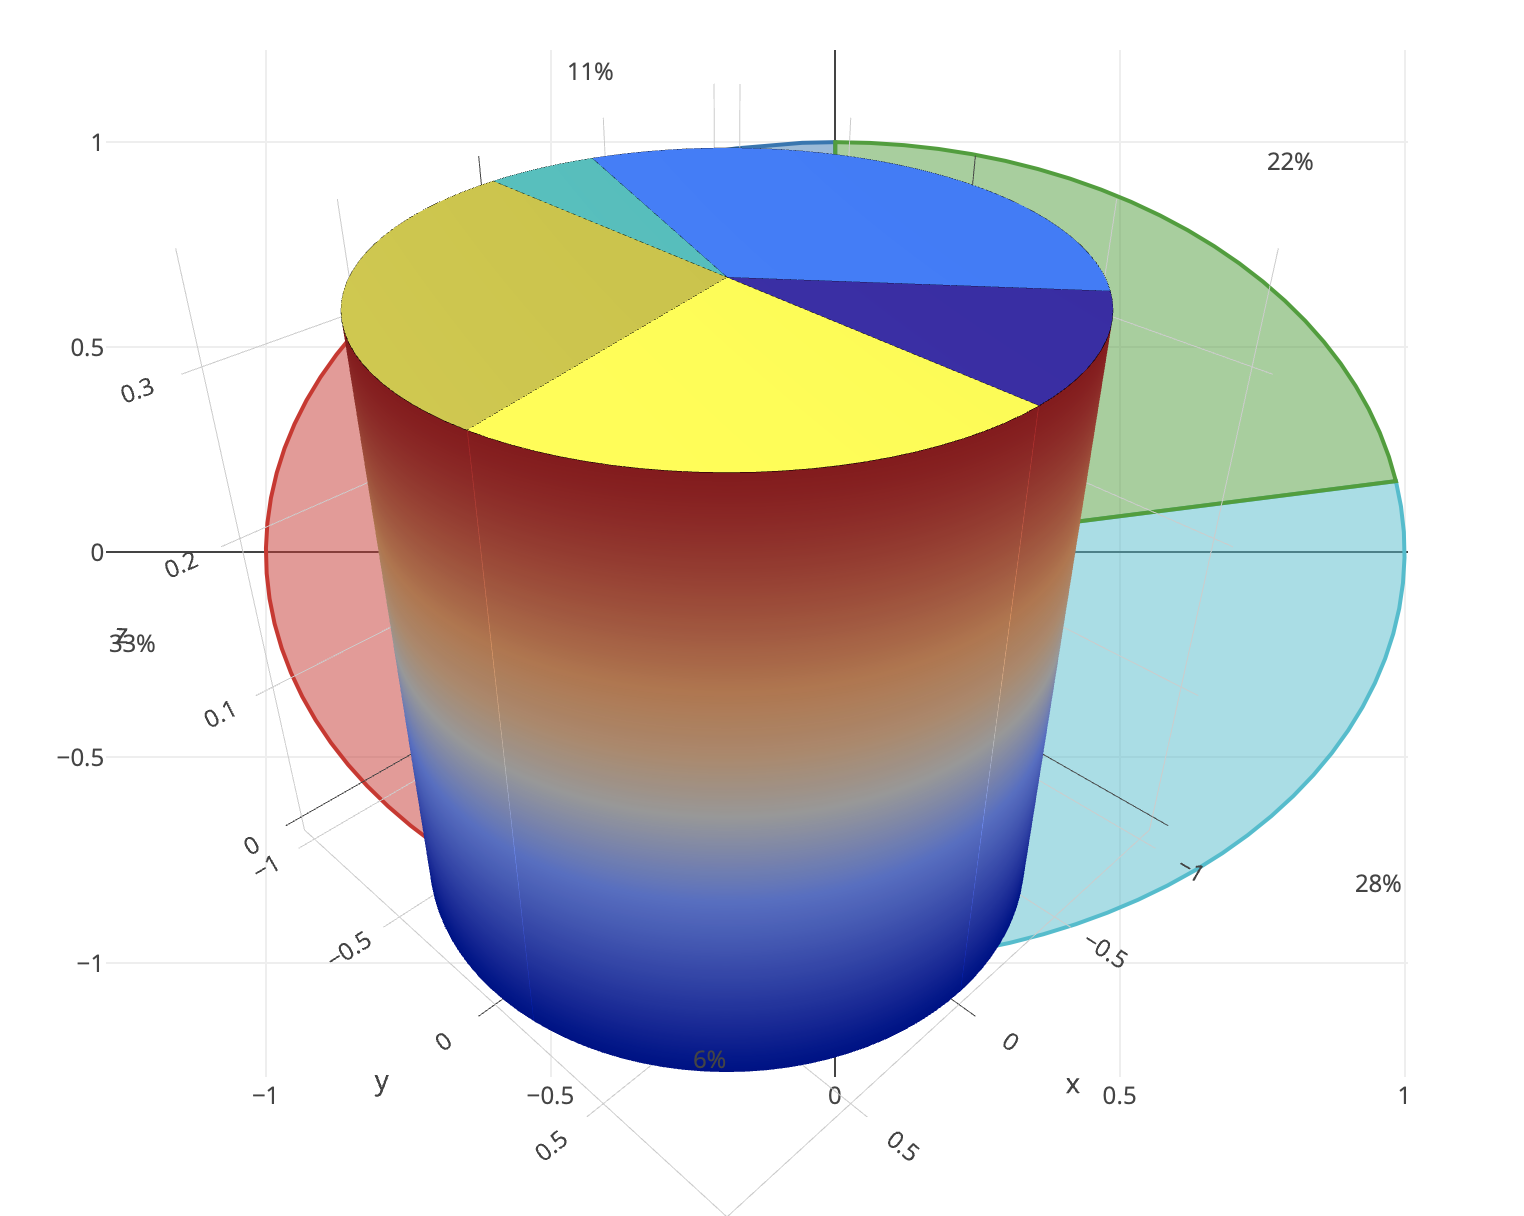
As seen, there are plenty of issues: chart's height is way too much, the grid is being plotted (when it shouldn't) and a 2-D pie chart seems to being plotted under the 3-D chart.

Examples on using pie3() can be found on:
https://www.mathworks.com/help/matlab/ref/pie3.html#responsive_offcanvas

@gilbertogalvis
Copy link
Contributor

At jack's request, today I was working on issue #199

PR #335 fix this issue

To test it, please run following code

close all, clc

x = [1,3,0.5,2.5,2];
figure
pie3(x)

fig2plotly(gcf, 'offline', false, 'TreatAs', 'pie3');

result looks as follow

Screen.Recording.2021-08-12.at.9.41.54.PM.mp4

Sign up for free to join this conversation on GitHub. Already have an account? Sign in to comment
Labels
None yet
Projects
None yet
Development

No branches or pull requests

4 participants