modified TableDescription formatting #616
Conversation
|
@edublancas The reason that we see a lot of NaN values is because of the operations that we are running on categorical vs numerical data. In Pandas they handle this in the following way
I have replicated it here, also there is an issue where numerical (int/float) data is stored as a string. Here this data gets treated like categorical data. |
 edublancas
left a comment
edublancas
left a comment
There was a problem hiding this comment.
looks great overall!
can we change the red background for yellow? Also, let's add some message below the table explaining why we have the yellow background.
something like "columns A, B, C are categorical, hence median, mean, cannot be computed"
Sure! making the changes |
|
@edublancas made the changes 
|
|
please merge from master, I think the error you're getting got fixed already @tonykploomber: is the error caused by the mariadb image problem you encountered? because the logs suggest the problem is with oracle |
|
Seems the latest build with this oracledb error too, however it's not impacted to the testing flow. I believe rebasing with latest master will solve the issue, however, something we need to check about oracledb |
|
@tonykploomber: can you open a dummy PR to master? let's see if things are working. otherwise we'll need to fix oracle as well |
|
I will rebase and try again. |
|
@edublancas ready for review |
edublancas
left a comment
There was a problem hiding this comment.
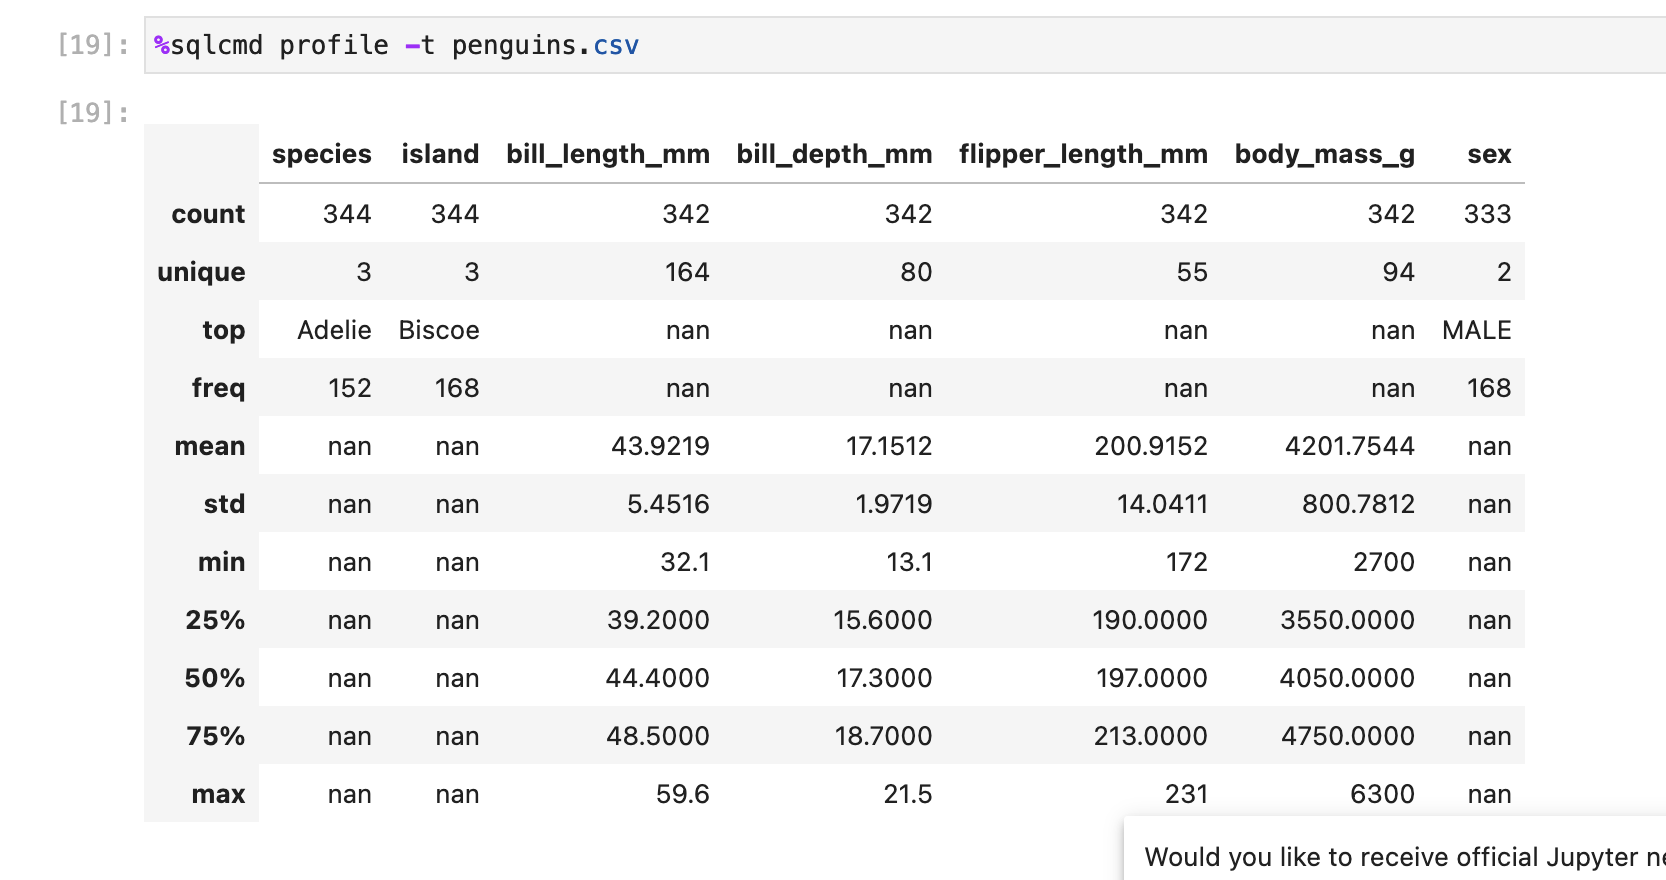
I tried testing this and I was expecting the island column to be yellow and to see the warning message since island is a string:

(using the penguins.csv dataset we download in the quick start)
am I doing something wrong?
please share the data you used for your tests so I can check it out
Hey, so the island column in the penguins dataset is made up of strings and is a categorical column(is not bade up of integers), we show the column to be yellow and add a warning message if the column is made of strings but contains numerical values (like ints/floats). Because of this we cannot properly query the statistics through SQL. In case of the churn.csv file the you can test it on either churn.csv file or this mock dataset:
|

There was a problem hiding this comment.
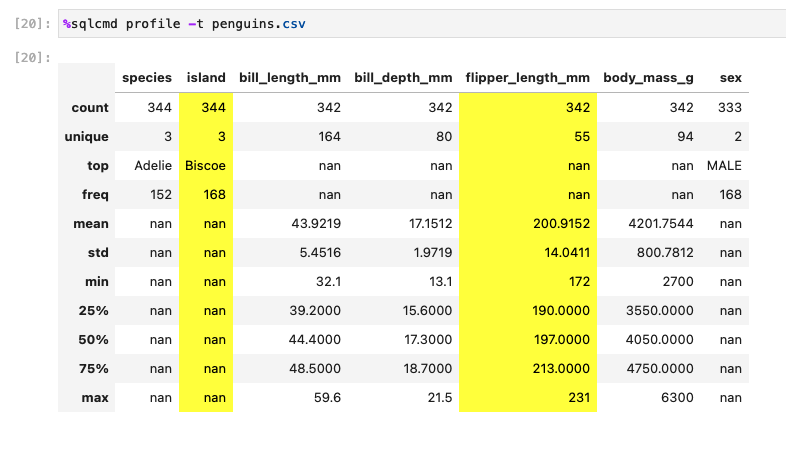
ok, I think I did something wrong because now when I profile penguins.csv I see it in yellow:

suggestion: can we make the yellow background softer? (the current one is too strong) the yellow one you show in the warning looks better, let's highlight the columns with the same color:

also, note that the warning shows.
`gender` <- backticks
can we change the backticks for something else? perhaps we can use
<code>column_name</code>
Making the changes to the styling, don't know why penguins.csv has the yellow columns now, runs fine locally. I will check it out. |

I think it's good that the island column in the penguins dataset is displayed on yellow, since we can't compute the statistics on strings. so let's keep it (if it's a bug, let's make it a feature 😂) having said that, we can also display a message like: |
 Hey @edublancas , so I fixed the bug (it was some global css styling issue). We can add styling for categorical columns but i think it would make the table a bit shabby if there are many such columns.
For instance, in the churn dataset, most of the columns are categorical columns, where we calculate top, freq, unique and count. So I am not sure if we should add styling to categorical columns |

Describe your changes
Modified the
TableDescriptionClass such that now weeg. 1.621e+1Now the
profilecommand acts similar to the pandasdescribefunctionJupysql profile
Pandas profile
Closes #459
Checklist before requesting a review
pkgmt format📚 Documentation preview 📚: https://jupysql--616.org.readthedocs.build/en/616/