

![]()

visreg is an R package for displaying the results of a fitted model in terms of how a predictor variable x affects an outcome y. The implementation of visreg takes advantage of object-oriented programming in R, meaning that it works with virtually any type of formula-based model in R provided that the model class provides a predict() method: lm, glm, gam, rlm, nlme, lmer, coxph, svm, randomForest and many more.
To install the latest release version from CRAN:
install.packages("visreg")To install the latest development version from GitHub:
remotes::install_github("pbreheny/visreg")The basic usage is that you fit a model, for example:
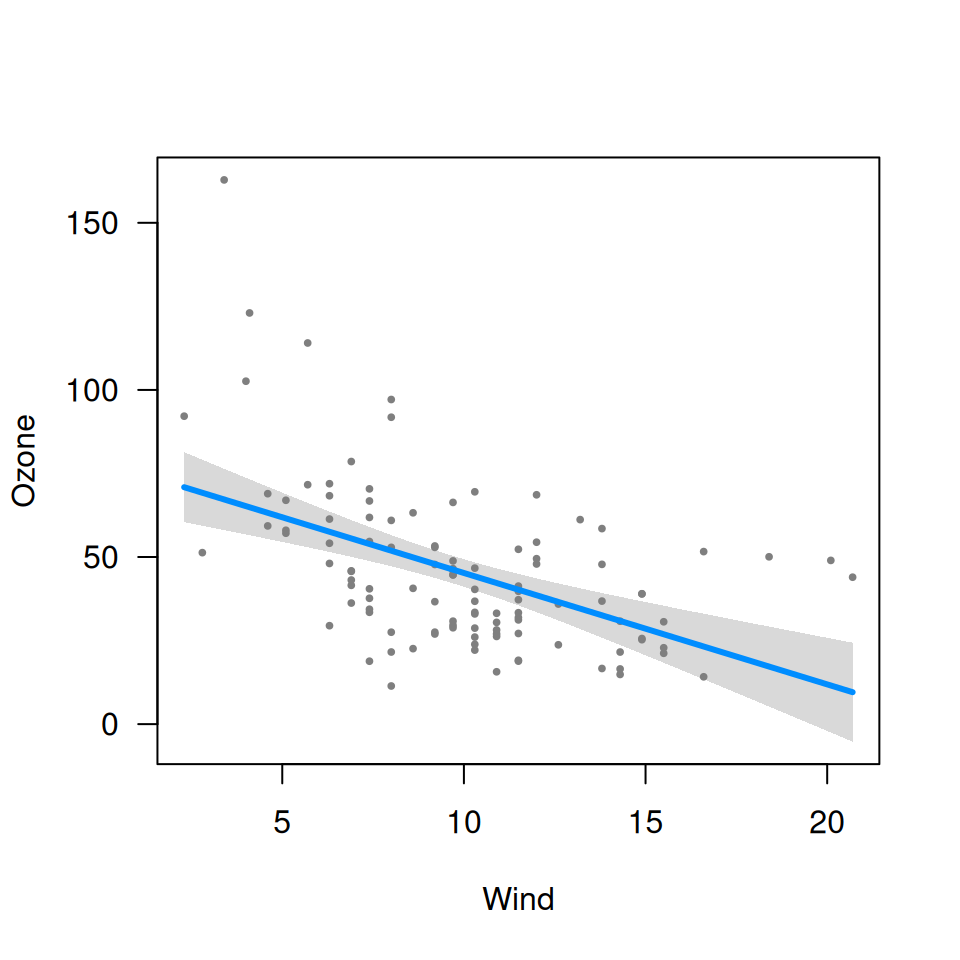
fit <- lm(Ozone ~ Solar.R + Wind + Temp, data=airquality)and then you pass it to visreg:
visreg(fit, "Wind")
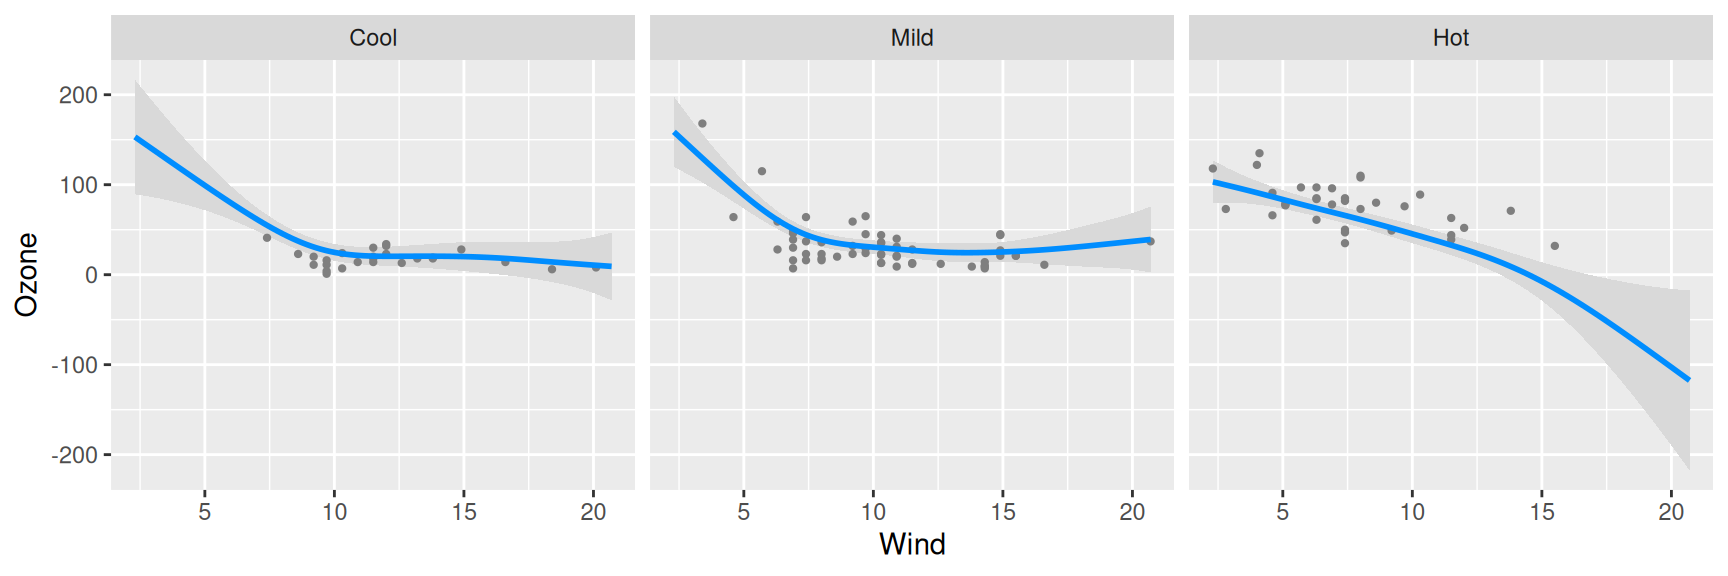
A more complex example, which uses the gam() function from mgcv:
airquality$Heat <- cut(airquality$Temp, 3, labels=c("Cool", "Mild", "Hot"))
fit <- gam(Ozone ~ s(Wind, by=Heat, sp=0.1), data=airquality)
visreg(fit, "Wind", "Heat", gg=TRUE, ylab="Ozone")
For more information on visreg syntax and how to use it, see:
- The online documentation at https://pbreheny.github.io/visreg/ contains many examples of visreg plots and the code to create them.
- Breheny P and Burchett W (2017). Visualization of Regression Models Using visreg. The R Journal, 9: 56-71.
The website focuses more on syntax, options, and user interface, while the paper goes into more depth regarding the statistical details.