Allow find_bad_channels_maxwell() to return scores #7845
Conversation
|
what do you want to do with that? how do you plan visualise this? |
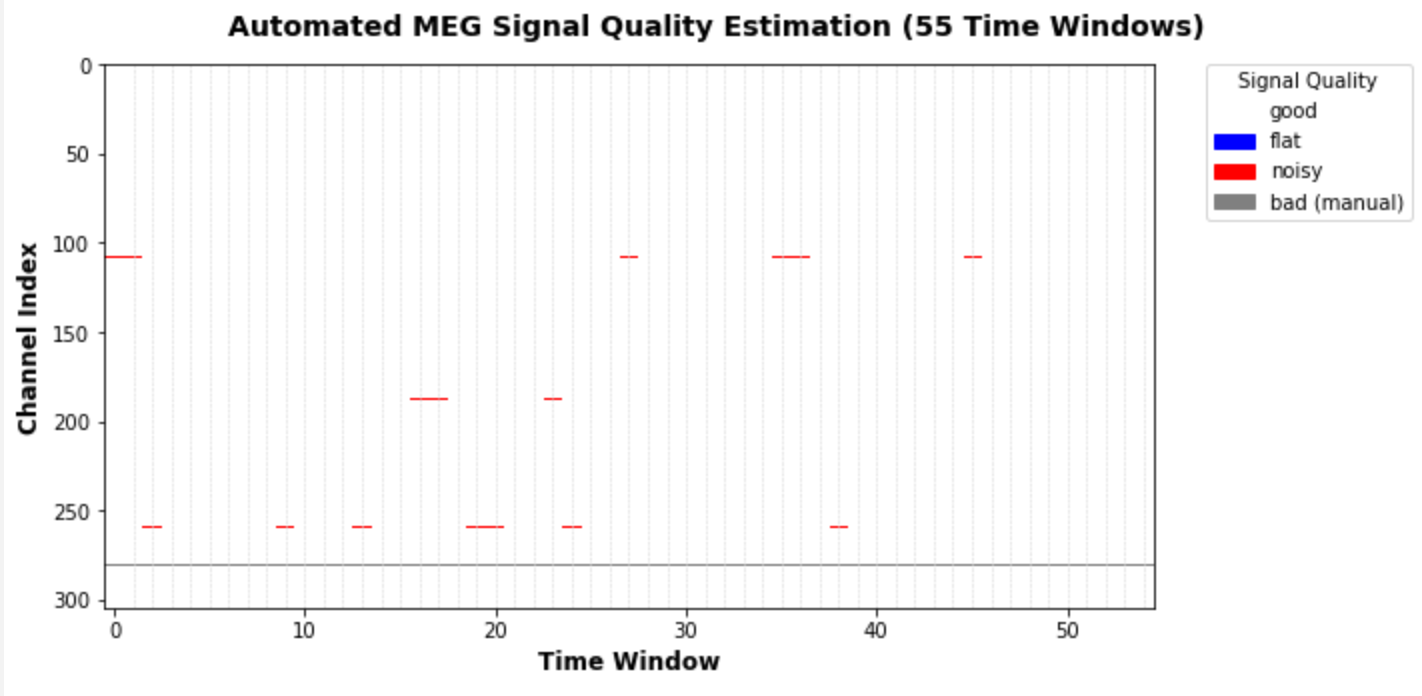
My idea was that we could plot it with time (or segment number) on the abscissa and channels on the ordinate. Bad segments for individual channels would be colored in based on the type of bad (flat, noisy, or manually set). My idea is to have sth that looks a little like the top-right subplot here, maybe even all of those subplots sans the spectrum: |

|
I think it's important to show what it can bring visually before updating
public API
|
Very first very drafty draft: I also want to add a topoplot with sensors shown in the respective colors. Edit: The colored lines should always extend to the vertical dashed lines. There seems to be a small bug in my plotting script. But I think you can get the idea nevertheless! |
|
@hoechenberger it seems this kind of plot could be profitably used for #7720 too. Maybe we should implement that, and use it to plot annotations from |
I had been thinking about this too. The issue with Annotations is that they extend across all channels, while here we're only interested in the temporal extent of a signal across individual channels… Any ideas how to reconcile this dichotomy? |
|
@drammock We can also talk off GH if you think it could make sense to brainstorm more quickly, just drop me a mail at [email protected] |
Just to elaborate on this a little more. What I currently return are just the auto-detected bad segments of those channels which the algorithm found to be bad based on these segments. I simply tag these segments as "bad because flat", "bad because noisy", so it's kind of like a binary thing (bad or not), not a score as such. We could also return the actual scores, which would make for a nice visualization: for each channel and time window, we would get a specific number (or score) that shows how "bad" that segment was. The plot would be very colorful and not as sparse as the one I posted above. Now there would be a few issues with this approach:
Potential solutions
… but that's also a lot of figures :) Thoughts? |
|
thoughts: play with it on real data see what is the most informative and ask
feedback from users like @SophieHerbst
… |
fair point; either you would need one |
|
adding support for subsets of channels in annotations was requested in the
past by some EEG users I know.
I said for now YAGNI but we may reconsider
… |
This could be a workaround, yes. But feels very hacky…
I think I do understand the general concept you're proposing, but what do you mean by "old annotation file"?
I have to say that this obviously sounds like the cleanest solution to me. I'm mostly worried about how to expose this in the Raw browser plot, i.e. how to make it so that you can select a time range & add an Annotation to only a subset of channels. |
|
yes supporting this in UI will be tricky. I propose to sleep over it a bit
more
… |
sorry, "any old annotation file" meant "any annotation file not created by |
|
Combining this with #1869 could potentially be quite useful |
|
Great idea, @larsoner! I will pick up working again on this PR shortly. |
Inspired by mne-tools/mne-bids-pipeline#118 (comment),
I have added a new parameter `return_scores` to
`preprocessing.find_bad_channels_maxwell()`.

If True, we will now return

- the edges of the time windows analyzed
- the corresponding evaluation of a channel being flat in this window
- the corresponding evaluation of a channel being noisy in this window

I currently refer to the latter two values as "scores", but actually
they are just boolean values. So the returned ndarrays `scores_flat`
and `scores_noisy` only contain True and False for each channels in
all evaluated time segments.
52b38e3 to
d59abd2
Compare
|
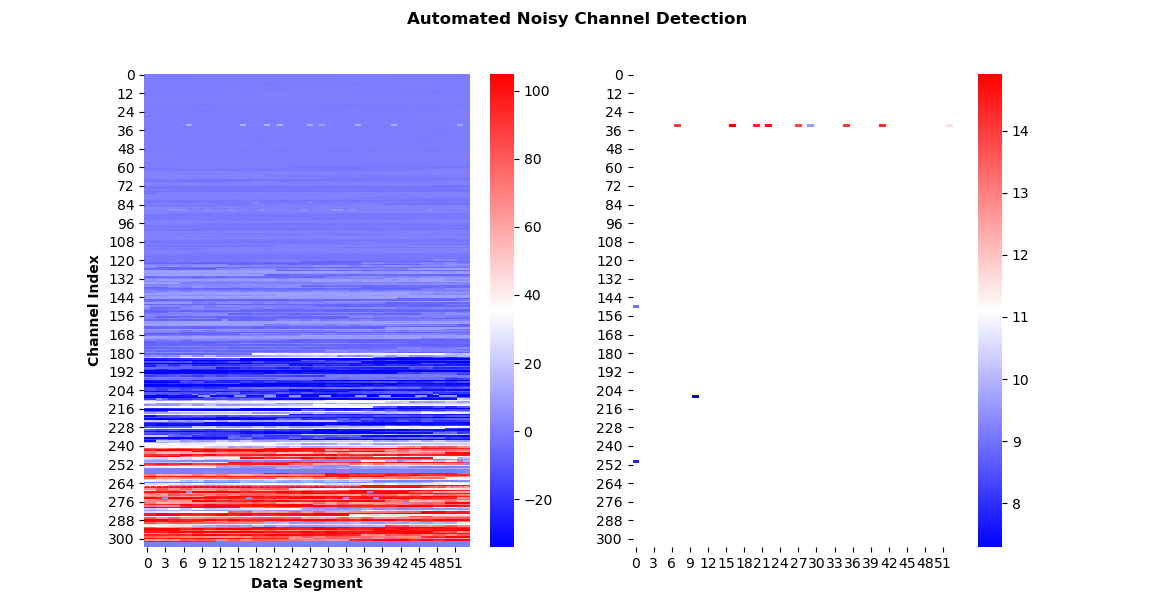
@drammock After discussing with @agramfort and critically reconsidering my specific use case, I have decided that for now I will just work on the implementation of "return more elaborate scoring results" within the scope of this PR. I believe your suggestion regarding the plotting does make a lot of sense, but I would address this in a followup PR. So what I've done now is I've changed the return value(s): When With very little code, I can now produce helpful visualizations (I know, the colormap is not great): auto_noisy_chs, auto_flat_chs, scores = find_bad_channels_maxwell(
raw=raw_lp_filtered_for_maxwell,
calibration=config.mf_cal_fname,
cross_talk=config.mf_ctc_fname,
return_scores=True)
bad_mask = np.ones_like(scores['scores_noisy'])
bad_mask[scores['scores_noisy'] > scores['limits_noisy']] = 0
fig, ax = plt.subplots(1, 2, figsize=(12, 5))
sns.heatmap(scores['scores_noisy'], cmap='bwr', ax=ax[0])
sns.heatmap(scores['scores_noisy'], mask=bad_mask, cmap='bwr', ax=ax[1])
ax[0].set_xlabel('Data Segment', fontweight='bold')
ax[0].set_ylabel('Channel Index', fontweight='bold')
fig.suptitle('Automated Noisy Channel Detection', fontweight='bold')
plt.show()
(absolute scores on the left, thresholded on the right) WDYT? |
seems reasonable. |
|
you will need to add tests and expose this in an example as an illlustration. |
Put them in separate |
|
@larsoner I now only plot gradiometer results. This avoids the whole issue of figure placement. Also, having two large-scale figures (for mag and grad) would probably be too much anyway. |

| "flat". | ||
| - ``scores_noisy`` : ndarray, shape (n_meg, n_windows) | ||
| The scores for testing whether MEG channels are noisy. | ||
| - ``limits_noisy`` : ndarray, shape (n_meg, 1) |
There was a problem hiding this comment.
why ndarray, shape (n_meg, 1)? It should be float, no? I see below you only set it for the good channels, but personally I would just leave it as a float (it's okay to set it for all channels because the bad ones get values of -np.inf so comparisons pass).
However, I just realized that a different, probably cleaner way around all of this: return ch_names : ndarray, shape (n_good_meg,) instead of shape (n_meg,) (and adjust all other vars, too). Then you only return what actually gets processed by the function.
Sorry for the run-around about this, hopefully just using n_good_meg makes everything cleaner...
There was a problem hiding this comment.
However, I just realized that a different, probably cleaner way around all of this: return
ch_names : ndarray, shape (n_good_meg,)instead ofshape (n_meg,)(and adjust all other vars, too). Then you only return what actually gets processed by the function.
That's what I started out with, and then made the decision to return all meg channels, including the bad ones (even though they would not have any values set): Because I expect this to make it easier to create an interactive visualization based on the arrays returned here. I'm thinking about something like the viz I put into the tutorial, but also displaying channels from info['bads'], and where clicking on a tile of the heatmap would take you straight to the corresponding raw segment. It would be very useful to show all channels, including bads, in such an interactive visualization. And this would be easier to achieve if we got an array of the correct shape (i.e., with n_meg rows) right from the beginning…
Thoughts?
There was a problem hiding this comment.
why
ndarray, shape (n_meg, 1)? It should befloat, no?
Also while this would work for the noisy channels, it wouldn't be applicable to the flat detection, because there we use different thresholds depending on channel type (mag, grad)
If the algorithm doesn't operate on / modify / analyze some channels, it doesn't seem like they should show up in the output at all. For example if you pass |
|
Thanks for the input, @larsoner! I will discuss this with @SophieHerbst to get a better idea of what users might need and expect.
…--
Sent from my phone, please excuse brevity and erroneous auto-correct.
On 11. Jun 2020, at 20:36, Eric Larson ***@***.***> wrote:
I expect this to make it easier to create an interactive visualization based on the arrays returned here. I'm thinking about something like the viz I put into the tutorial, but also displaying channels from info['bads'], and where clicking on a tile of the heatmap would take you straight to the corresponding raw segment.
If the algorithm doesn't operate on / modify / analyze some channels, it doesn't seem like they should show up in the output at all. For example if you pass ignore_ref to maxwell_filter, those channels shouldn't show up even though they are MEG channels. Downstream viz should be built to take into account the channels that were actually processed, regardless of actual data ordering, channel selection, etc., so I don't see simplifying the viz step as sufficient motivation for including info['bads'] MEG channels in the output.
—
You are receiving this because you were mentioned.
Reply to this email directly, view it on GitHub, or unsubscribe.
|
|
@larsoner
I've also added a warning to the Let me know what you think! Otherwise, this is all good to go from my side. |
|
I can live with it, thanks @hoechenberger ! |
| "noisy". | ||
|
|
||
| .. note:: The scores and limits for channels marked as ``bad`` in the | ||
| input data will will be set to ``np.nan``. |
| .. warning:: This feature is experimental and may change in a future | ||
| version of MNE-Python without prior notice. Please | ||
| report any problems and enhancement proposals to the | ||
| developers. |
| # channels: | ||
| # Now we can update the list of bad channels in the dataset. | ||
|
|
||
| bads = [*raw.info['bads'], *auto_noisy_chs, *auto_flat_chs] |
There was a problem hiding this comment.
bads = raw.info['bads'] + auto_noisy_chs + auto_flat_chs
seems simpler especially for non python gurus
* upstream/master:
  MRG, FIX: Speed up I/O tests, mark some slow (mne-tools#7904)
  Proper attribution for Blender tutorial (mne-tools#7900)
  MAINT: Check usage [ci skip] (mne-tools#7902)
  Allow find_bad_channels_maxwell() to return scores (mne-tools#7845)
  Warn if NIRx directory structure has been modified from original format (mne-tools#7898)
* upstream/master: (24 commits)
  WIP: Fix Travis (mne-tools#7906)
  WIP: Prototype of notebook viz (screencast) (mne-tools#7758)
  MRG, FIX: Speed up I/O tests, mark some slow (mne-tools#7904)
  Proper attribution for Blender tutorial (mne-tools#7900)
  MAINT: Check usage [ci skip] (mne-tools#7902)
  Allow find_bad_channels_maxwell() to return scores (mne-tools#7845)
  Warn if NIRx directory structure has been modified from original format (mne-tools#7898)
  Pin pvyista to 0.24.3 (mne-tools#7899)
  MRG: Add support for reading and writing sufaces to .obj (mne-tools#7824)
  Fix _auto_topomap_coords docstring. (mne-tools#7895)
  MRG, FIX: Ensure Info H5-writeable (mne-tools#7887)
  Website contents (mne-tools#7889)
  MRG, ENH: Add mri_resolution="sparse" (mne-tools#7888)
  MRG, ENH: Allow disabling FXAA (mne-tools#7877)
  remove "and and" [ci skip] (mne-tools#7882)
  fix evoked nave → inverse guidance (mne-tools#7881)
  ENH: Better error messages (mne-tools#7879)
  FIX : EDF+ Annotation Timestamps missing sub-second accuracy (mne-tools#7875)
  FIX: Fix get_channel_types (mne-tools#7878)
  MRG, BUG: Fix combine evokeds (mne-tools#7869)
  ...
* upstream/master: (23 commits)
  MAINT: Add mne.surface to docstring tests (mne-tools#7930)
  MRG: Add smoothing controller to TimeViewer for the notebook backend (mne-tools#7928)
  MRG: TimeViewer matplotlib figure color (mne-tools#7925)
  fix typos (mne-tools#7924)
  MRG, ENH: Add method to project onto max power ori (mne-tools#7883)
  WIP: Warn if untested NIRX device (mne-tools#7905)
  MRG, BUG: Fix bug with volume morph and subject_to!="fsaverage" (mne-tools#7896)
  MRG, MAINT: Clean up use of bool, float, int (mne-tools#7917)
  ENH: Better error message for incompatible Evoked objects (mne-tools#7910)
  try to fix nullcontext (mne-tools#7908)
  WIP: Fix Travis (mne-tools#7906)
  WIP: Prototype of notebook viz (screencast) (mne-tools#7758)
  MRG, FIX: Speed up I/O tests, mark some slow (mne-tools#7904)
  Proper attribution for Blender tutorial (mne-tools#7900)
  MAINT: Check usage [ci skip] (mne-tools#7902)
  Allow find_bad_channels_maxwell() to return scores (mne-tools#7845)
  Warn if NIRx directory structure has been modified from original format (mne-tools#7898)
  Pin pvyista to 0.24.3 (mne-tools#7899)
  MRG: Add support for reading and writing sufaces to .obj (mne-tools#7824)
  Fix _auto_topomap_coords docstring. (mne-tools#7895)
  ...
* upstream/master: (30 commits)
  MRG: Add remove_labels to _Brain (mne-tools#7964)
  Add get_picked_points (mne-tools#7963)
  ENH: Add OpenGL info to mne sys_info (mne-tools#7976)
  [MRG] Fix reject_tmin and reject_tmax for reject_by_annotation in mne.Epochs (mne-tools#7967)
  mrg: Add scalar mult and div operators for AverageTFR (mne-tools#7957)
  MRG, MAINT: Cleaner workaround for Sphinx linking issue (mne-tools#7970)
  MRG, ENH: Speed up epochs.copy (mne-tools#7968)
  MRG, BUG: Allow ref mags to have a comp grade (mne-tools#7965)
  do not forget to pass adjacency (mne-tools#7961)
  [MRG] fix Issue with stc.project after restricting to a label (mne-tools#7950)
  Only process nirx event file if present (mne-tools#7951)
  MRG+1: BUG: info['bads'] order shouldn't matter in write_evokeds() (mne-tools#7954)
  Fix some small glitches introduced via mne-tools#7845 (mne-tools#7952)
  Add time player (mne-tools#7940)
  MAINT: Clean up VTK9 offset array [circle front] (mne-tools#7953)
  MAINT: Skip a few more on macOS (mne-tools#7948)
  fix links [skip travis] (mne-tools#7949)
  MRG, MAINT: Tweak CIs (mne-tools#7943)
  MRG, BUG: Fix vector scaling (mne-tools#7934)
  MRG, VIZ, BUG: handle CSD channel type when topo plotting (mne-tools#7935)
  ...
What does this implement/fix?
Inspired by mne-tools/mne-bids-pipeline#118 (comment), I have added a new parameter
return_scorestopreprocessing.find_bad_channels_maxwell().If True, we will now return a dictionary with alle the scores, limits, and corresponding channel names and types.
- the edges of the time windows analyzed - the corresponding evaluation of a channel being flat in this window - the corresponding evaluation of a channel being noisy in this windowI currently refer to the latter two values as "scores", but actually they are just boolean values. So the returned ndarrays
scores_flatandscores_noisyonly contain True and False for each channels in all evaluated time segments. Wonder if there's a better name we could use?Additional information
I first wanted to ask for feedback before starting to add tests.