Uses CSS flex-box for display of svg elements #15
Conversation
|
How can I observe what this changes? All I'm noticing when I run the demo app is that the content is now centered, other than that I'm not seeing much difference (including when I zoom the page). |
@k-rister we needed the SVG elements to fit to its parent div dynamically. So I used flexbox to the division containing the SVG elements so that, the elements inside that can be arranged in a predictable way for different screen sizes and browsers. I have arranged the charts in the center considering the charts to be inside different divisions instead of directly being children of the body element. |
|
Hmm, I guess I misinterpreted what this was. I thought it was something related to scaling the size of the SVG -- is that not the case? |
|
It won't exactly scale the SVG instead, it will try to fit the size of the SVG elements to their parent containers and align them to their center. (SVG will change size according to the parent container) |
|
So is it accurate to say that it will only scale the SVG down (make it smaller) if the parent container isn't large enough for the default SVG size and if the parent container is larger than the default SVG size then nothing will happen other than it being centered? |
|
Yes. But if we don't mention any default size of the SVG, then the flexbox should make the SVG fit to the lager parent containers as well. |
|
Ok, seems fine to me. |
|
@anisha1234 We'll want to scale the SVG to ensure the jschart div takes the parent div's full dimensions accordingly. In the testing environment, it seems the jschart div is centered in the parent div whereas we require the SVG elements to grow and shrink in size. For more on scaling SVGs: https://css-tricks.com/scale-svg/ @k-rister Should we consider maintaining the aspect ratio of graphs as part of this behavior? |
|
@gurbirkalsi I think we should maintain the aspect ratio. While I haven't tested it, I don't think it would look very good if the aspect ratio is not maintained. |
|
@gurbirkalsi I have committed some changes for scaling the graph as per the parent container. What I did is, I have set the table width as 100% to fit the parent container and for SVG I have used flexBox with |
|
That is pretty slick, I like it. It does lead to the potential for some really large graphs which is kinda weird, is there any way to control this? |
@k-rister do you want me to give more padding around the graph to control the width? |
|
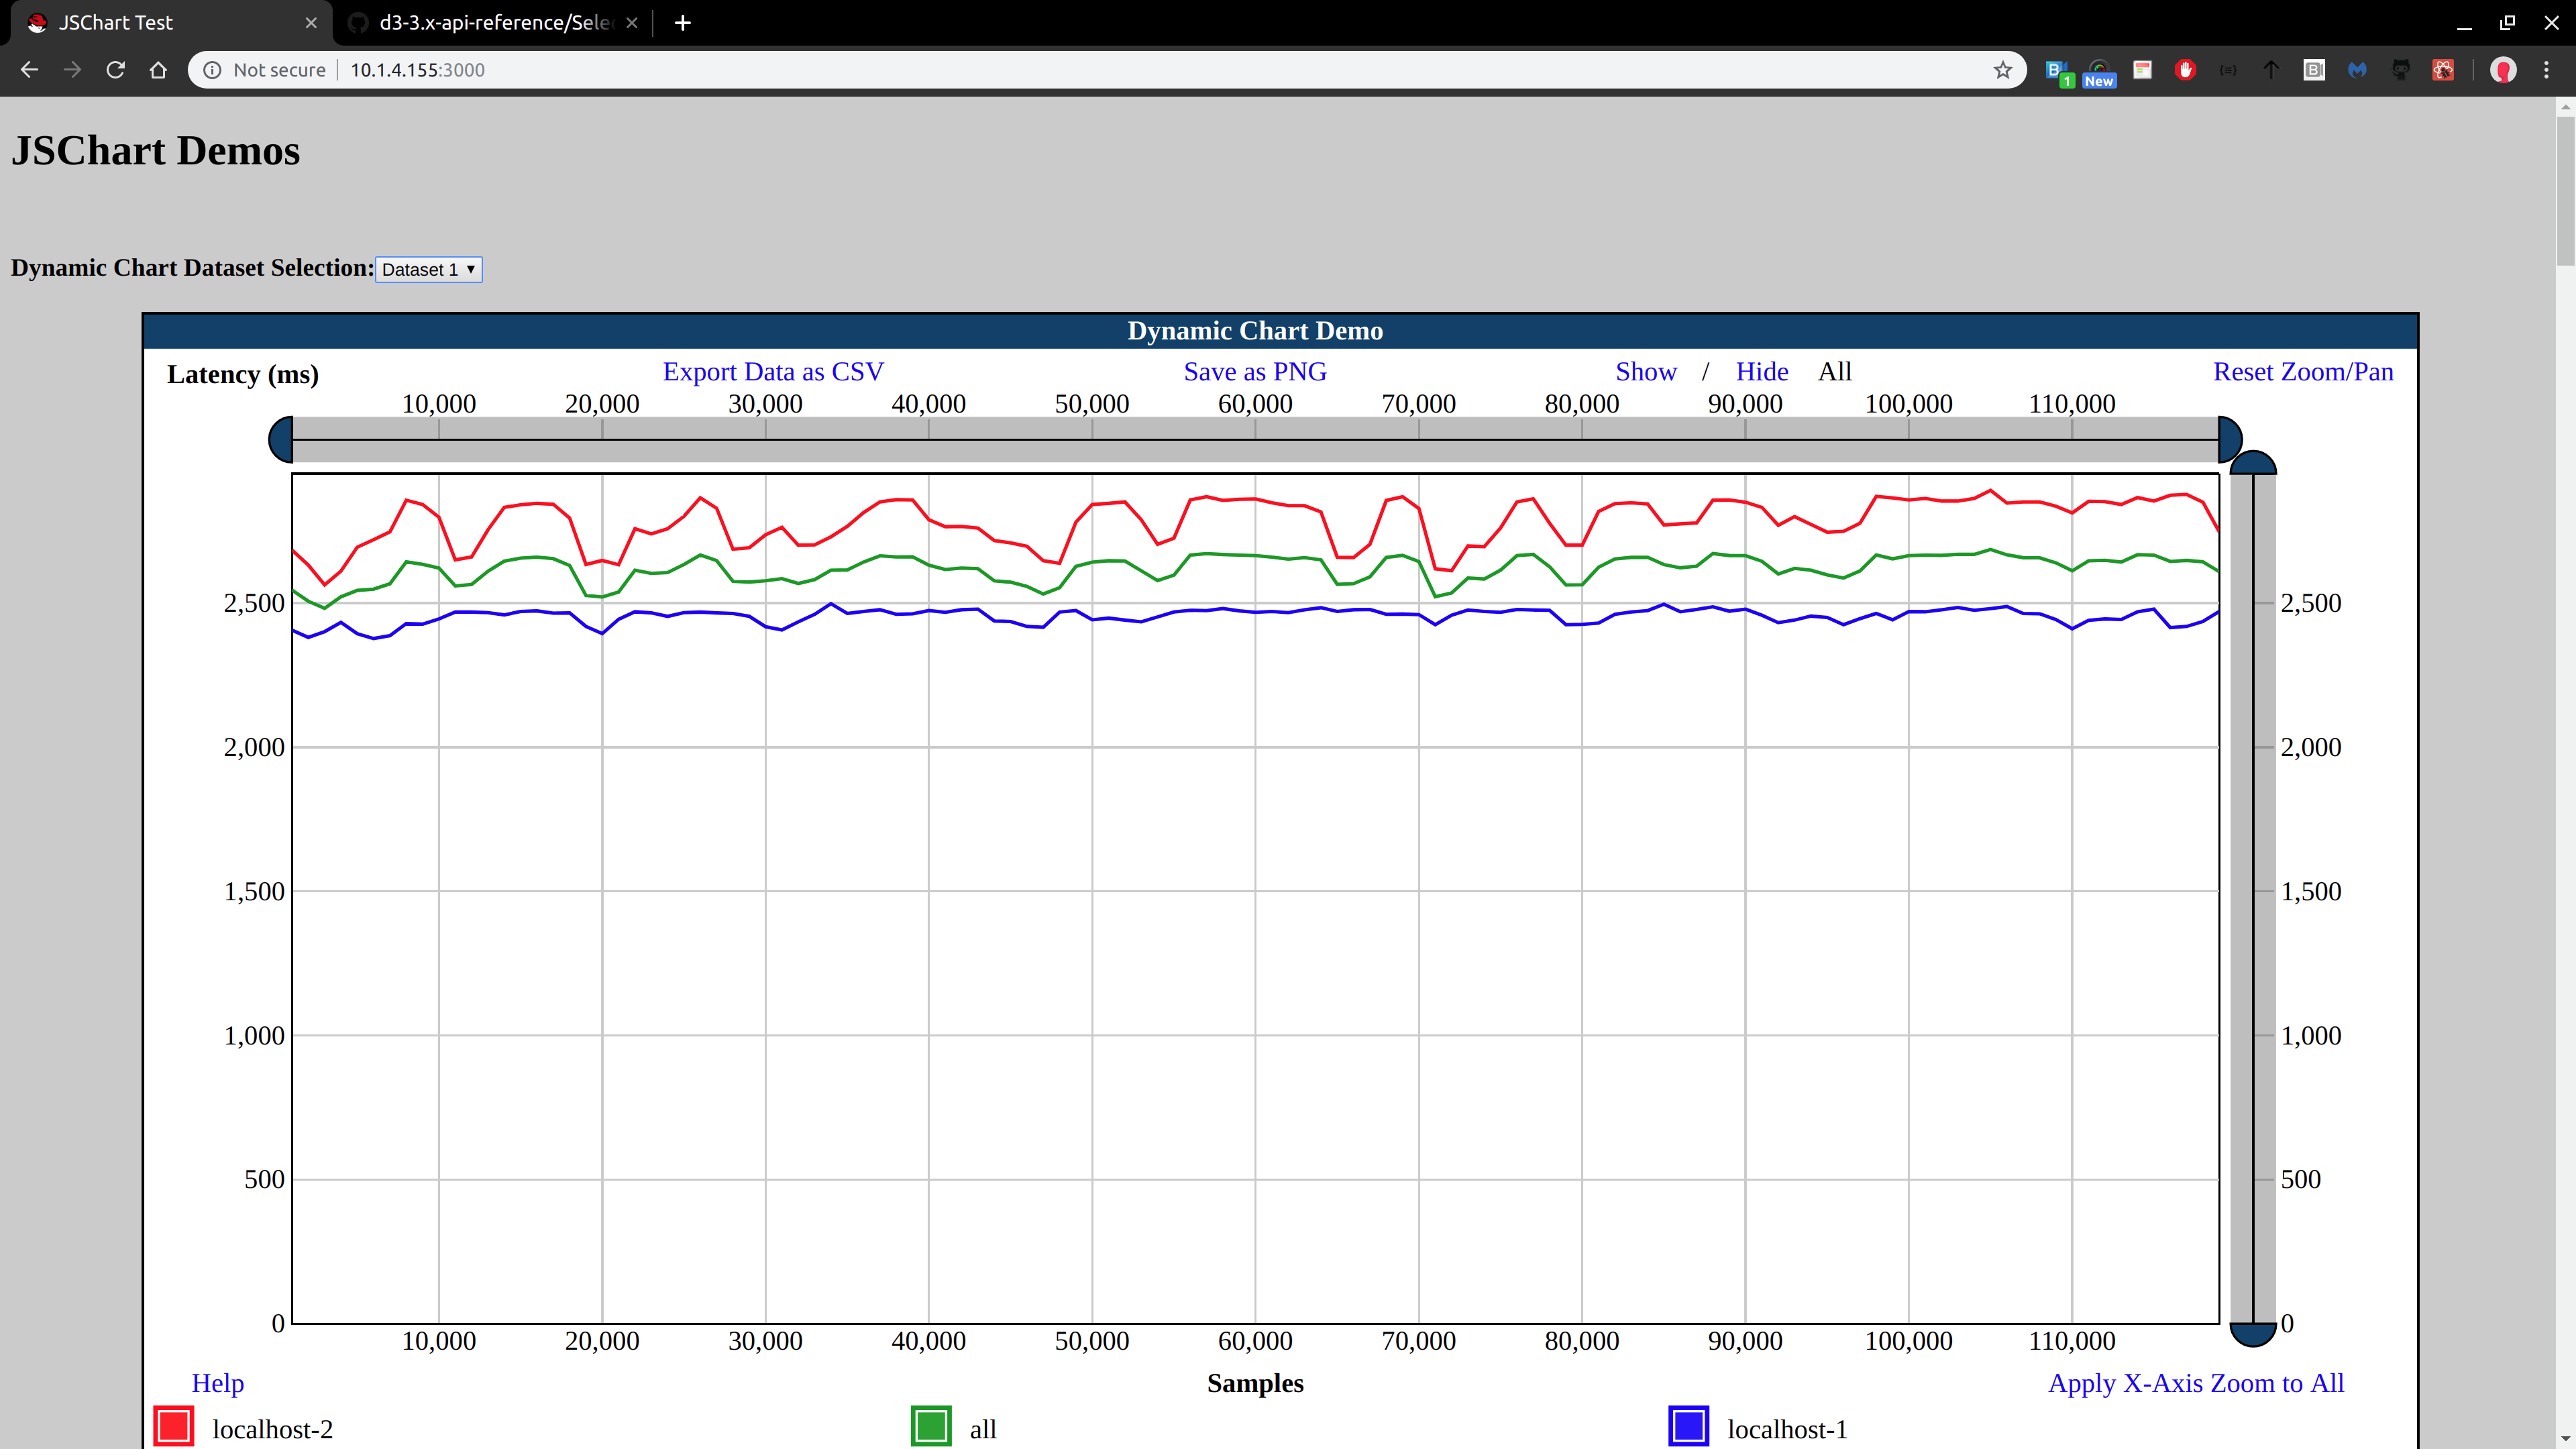
I'm not sure if padding is the answer, I don't think it is unless I'm not thinking about it correctly. Padding will just add some arbitrary border space that is consistently applied, for example X pixels on either side of the chart, right? I'm not sure that just a little bit of padding really solves the issue, it seems like a preset maximum scaling size might be ideal with some kind of ability to override it if absolutely necessary. Is that possible? I'm running a 27" 4K monitor with 200% HiDPi scaling (so it looks like a 1080p display) and when I maximize the browser window the resuling chart is extremely large:
|
|
Alright. I understood the issue now. Will check it and let you know. |
|
@k-rister I have introduced |
There was a problem hiding this comment.
The max-width stuff seems to work pretty well from what I can tell. Thanks!
You should take a look at the cdm-tests demo where your changes have not been integrated (into the page) but the updated JS library is being used. The page's layout has been modified and the chart's height is not scaling as the number of data sets is being manipulated.
I think ideally existing pages should work unchanged, but that might not be possible.
It's unclear to me at this point if the chart height scaling isn't working because the page has not been updated or if this aspect of the library is broken right now. Any chart with > 5 data sets (as I recall) will require this functionality to work to see all of the data sets in the legend.
I also had a few minor comments about some of the changes.
jschart/index.js
Outdated
| } | ||
|
|
||
| function get_svg_height(chart) { | ||
| console.log(chart.dimensions.viewport_height + |
There was a problem hiding this comment.
Is this just some debugging code that got left in?
There was a problem hiding this comment.
Yes, it was left by mistake. Resolved now. Do you think it will be a good idea to integrate ESlint in JSchart?
Please enter the commit message for your changes. Lines starting
|
Can you stop force pushing changes and wait until this PR is complete to squash/amend the commits? Force pushing makes it very hard to track the changes as we discuss updates. Thanks. |
JSchart requires flexibility in styling by taking the full dimensions of the parent div by transforming the SVG using flex-box.
This PR implements flexbox for aligning the graphs inside a container and viewBox for scaling the SVGs.