Redis timeouts and memory dump shows... deadlock? #2304
Description
We were running a load test on our Azure App Service and I see some confusing results. Actually the applications crashed, mostly an OutOfMemoryException, but the dump files and logs show some data that I would like to fully comprehend. First of all, most of the logs show something like:
Timeout awaiting response

(outbound=5490KiB, inbound=13804KiB, 8890ms elapsed, timeout is 5000ms),
command=GET,
active: GET XXX,
next: GET XXX,
inst: 0,
qu: 175,
qs: 0,
aw: True,
bw: WritingMessage,
rs: ComputeResult,
ws: Writing,
in: 65536,
serverEndpoint: xxx,
mc: 1/1/0,
mgr: 8 of 10 available,
clientName: XXX(SE.Redis-v2.5.43.42402),
IOCP: (Busy=5,Free=995,Min=200,Max=1000),
WORKER: (Busy=13,Free=1010,Min=200,Max=1023),
POOL: (Threads=138,QueuedItems=25,CompletedItems=9768),
v: 2.5.43.42402
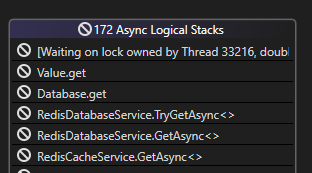
The dump files shows there are 172 tasks waiting on another thread:
Which is actually this code:
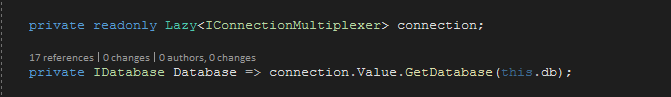
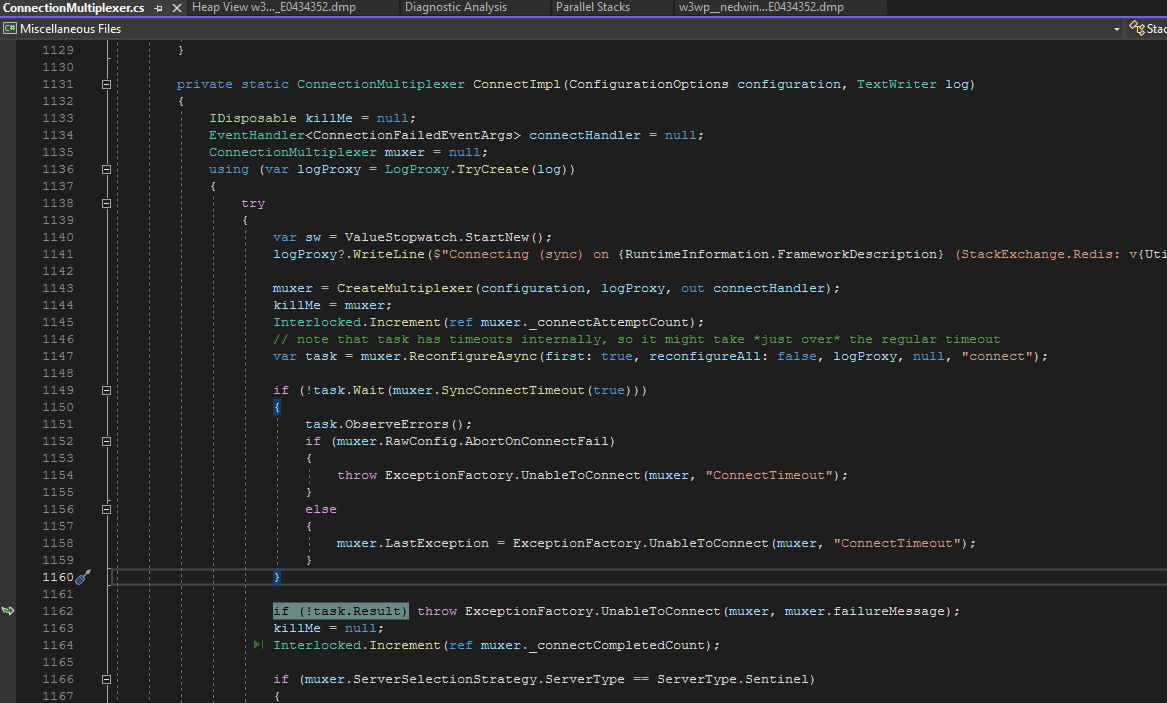
Then if I drill down on the "lock owned by thread 33216" it points me to this line of code:
Questions:
- Is this an actual deadlock?
- Do these 172 threads more or less correlate with the
qunumber in the log message (which is the number of items queued to be written if I am correct) - What is the difference between
inboundandin? - Any other troubling observations from the log?
I have a feeling we were just CPU bound on our App Service (even though we weren't hitting 100% CPU) and what I am seeing is the consequence of that, but I just want to be sure.