Python 3.11 profiling causes memory leaks #4899
Description
Summary of problem
This is possibly related to what's being fixed in #4895
Running latest release of dd-trace-py with Python 3.11 and having DD_PROFILING_ENABLED: "true" causes memory leaks.
Which version of dd-trace-py are you using?
1.7.0
Which version of pip are you using?
22.3.1
Which libraries and their versions are you using?
Let me know if you need more details on this, but I'm using Django, Django Rest Framework, and Celery (all latest versions as of this writing)
How can we reproduce your problem?
Run a web app as mentioned in the summary, and check memory usage.
What is the result that you get?
See image on the right side (after deploying with change to new version and enabling profiling, the deploy is in the middle), pod and processes inside pod were OOMing when hitting 100% of memory limit.
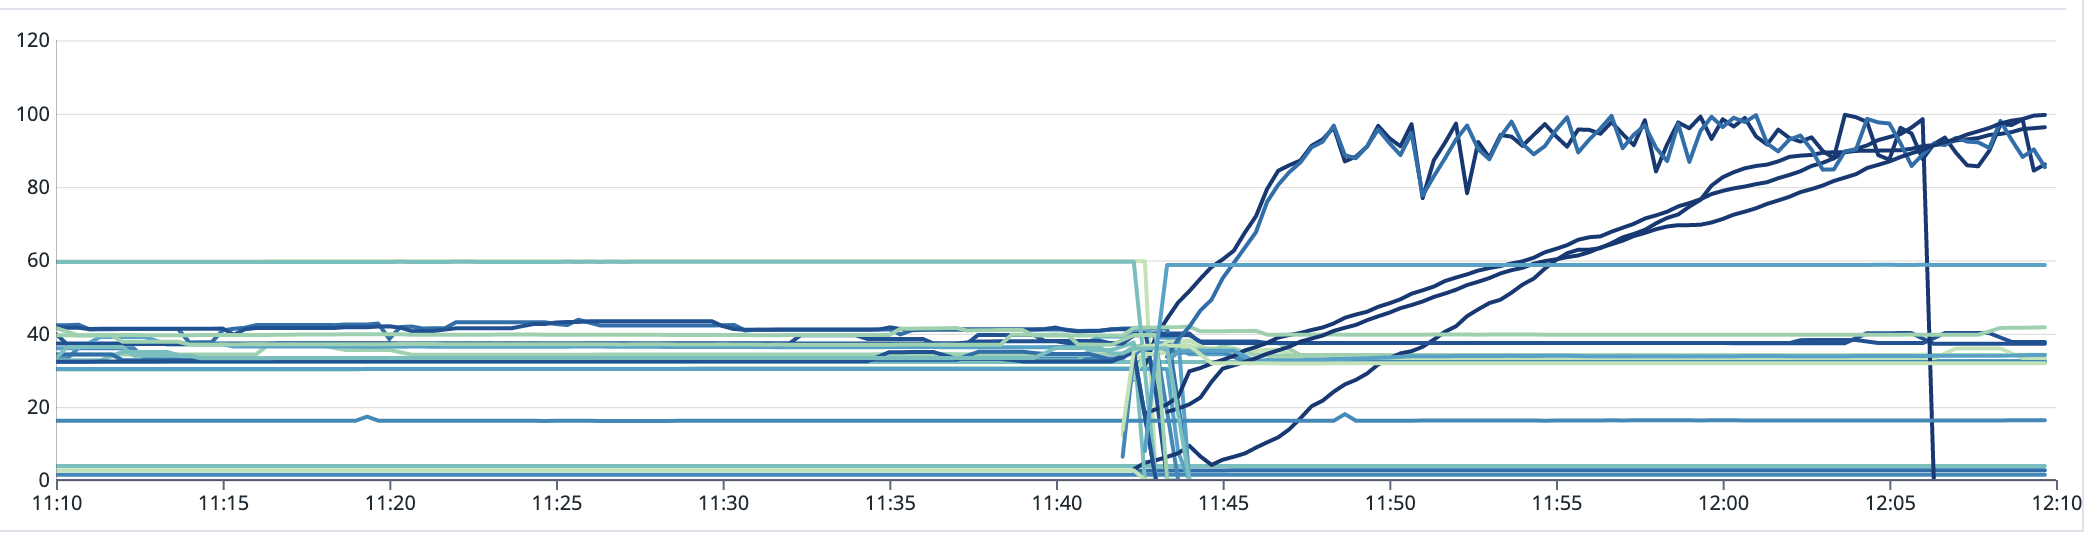
What is the result that you expected?
Flat memory usage (similar to left side of graph above with profiling disabled)