Visualizing world coordinate pose map #39
Description
Hello,
I am a student who just very new to every contents written in this project (Python, PyTorch, CNN, movement estimation, etc.) and I want to learn basics by replicating your work :).
I could replicate most of your work but now I got stuck doing visualize the prediction poses and then compare to the KITTI ground truth poses data as similar as shown below:
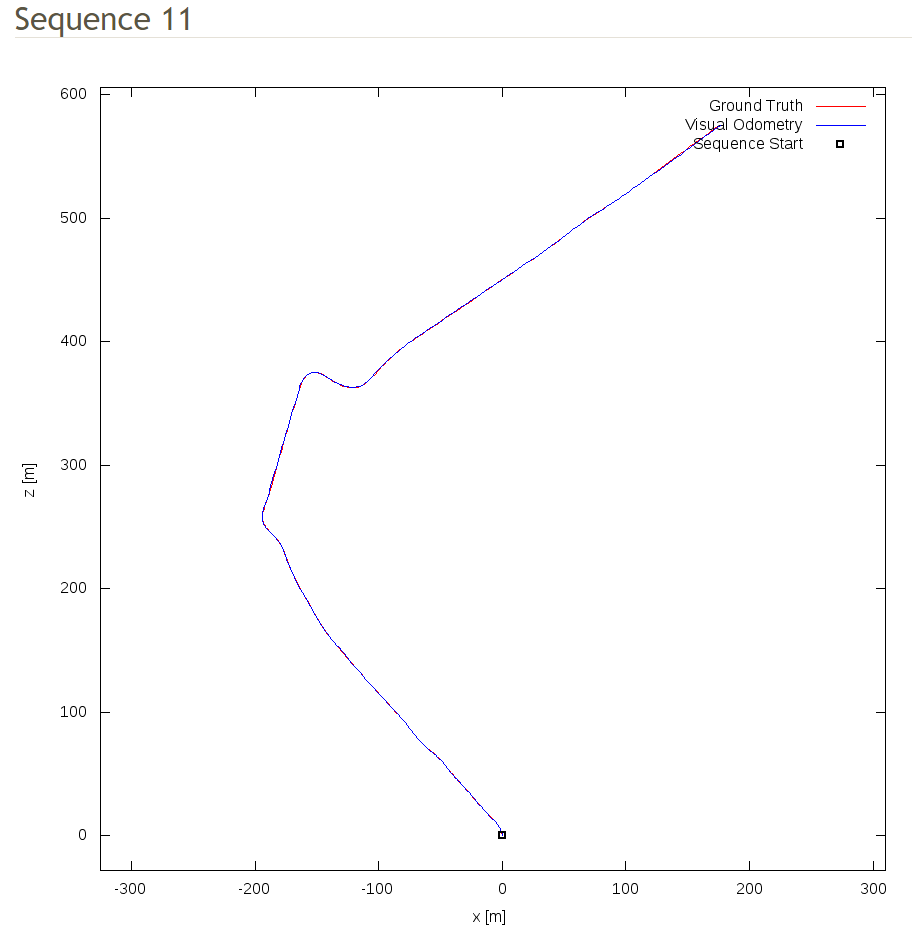
I could draw the ground truth map with no problems. How your code as well as explained in the paper seem using 5-frame snippets for prediction, therefore the output final_poses has size [pics_number, frame_number, 3, 4] while KITTI ground truth poses data only has size [pics_number, 3, 4]. I don't know how to deal with this array to draw visual odometry map so could you please show me how to do it?
One more thing, sorry for my bad English but in file times.txt got from downloading the KITTI odometry data set which explained : "Timestamps for each of the synchronized image pairs in seconds", is it the time between frames?
Please correct me if I am wrong at any point.
Thank you very much!