2D bounds - simple version #370
Conversation
for more information, see https://pre-commit.ci
|
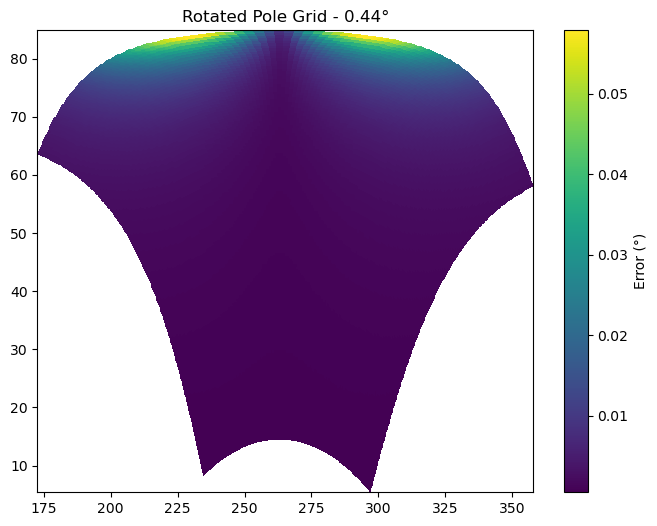
After discussion with a member of the team running the model from which I took my rotated pole grid example, I realized that the "reference" grid corners I was using were in fact generated in almost the same way as my "projection" method. So, disregard the left graphic above. The right graphic still gives an idea of the error (in lat lon degrees) between the projection method (which we can treat as "exact") and the interpolation method implemented in this PR. The base grid above has a resolution of around 0.11°, thus the error goes up to 2% of that resolution. This next figure is the same kind of comparison but with a 0.44° grid: But is it good enough for My other idea for this issue was to:
|
|
@aulemahal as a user of |
Not small but the dataset should really contain these by default :) @larsbuntemeyer Do you ever need something like this? If so, does this approach look reasonable to you?
I really don't know. We should document this clearly though, both in the docstring and in the docs. Your example with the relative error graphic is nice. We should add that to the docs. |
for more information, see https://pre-commit.ci
|
@dcherian Just pushed some doc in the I also checked if it works with |
Co-authored-by: Deepak Cherian <[email protected]>
for more information, see https://pre-commit.ci
|
LGTM. Thanks a lot @aulemahal ! cc @jbusecke |
|
Oh this is dope! If I understand correctly what is implemented here (just took a very quick look, will test next week hopefully) this might help a lot with getting rid of the dreaded I am still very curious about the suggestions in @larsbuntemeyer s answer (e.g. an even more precise way to 'generate curvilinear grids' but I am not sure that is within the scope of cf-xarray? Maybe it is. Happy to talk more about this in the future. Particularly I am interested if such an approach could enable us to recompute curvilinear grid metrics like cell area more accurately then doing some sort of But first and foremost a huge thanks to @aulemahal for working on this! |
Fixes #71!
I went through
xgcm's code (using 0.6.1) and realized that the proposed solution for estimating 2D bounds was indeed quite simple! And that we already had the functions to implement it.So here I enable
ds.cf.add_boundsto estimate 2D bounds by estimating the 1D bounds on the two axes successively, and then reordering the values to fit the conventions.dimargument can now be a list (of length 1 or 2)boundsdim already exists and has a different length than the new one, the latter is renamedbounds2, which is a bit inelegant... Any ideas?xESMF), but I'm not 100% sure I coded the right one.I first used @zxdawn's gist (https://gist.github.com/zxdawn/49c73e4d1ef9043580644e57eaa16d83) with xgcm 0.6.1. This implementation in cf-xarray does almost the exact same thing. I then compared with an old gist of mine (https://gist.github.com/aulemahal/58c0df9757635cb9b7f862a6d2a223ab) where I generated grid bounds for a RotatedPole grid. The idea there was to generate the 1D bounds on the regular rlat/rlon grid and then use cartopy/pyproj to project them to lat/lon.
I compared this PR's implementation with the projection one and the model-provided bounds for a regional model grid at a resolution of 0.11° and I got this :

The maps show the distance between the estimated bounds with the reference ones. Units are lat/lon degrees, so this means an error of maximum 2% of the grid resolution for this implementation. Seems reasonable to me, what do you think?
In the parent issue, there was a detailed proposition of moving the interesting grid and metric generation form xgcm to cf-xarray. I think it is still an interesting idea, but I felt the specific issue of 2D bounds was long overdue!
CI issues seems to be unrelated to the PR, but rather to #365 and may be an update in xarray?Ok,there are indeed issues with this PR 😓 .