Skip to content

Pressing enter only results in inserting a newline after more than half a minute #1331

New issue

Have a question about this project? Sign up for a free GitHub account to open an issue and contact its maintainers and the community.

By clicking “Sign up for GitHub”, you agree to our terms of service and privacy statement. We’ll occasionally send you account related emails.

Already on GitHub? Sign in to your account

Closed
Wodann opened this issue May 26, 2019 · 39 comments · Fixed by #1334
Closed

Pressing enter only results in inserting a newline after more than half a minute #1331

Wodann opened this issue May 26, 2019 · 39 comments · Fixed by #1334
Assignees

Comments

@Wodann
Copy link

Wodann commented May 26, 2019

After installing the latest version of rust analyzer, I noticed that pressing Enter (either the default or numpad Enter) doesn't result in a newline. After a seemingly arbitrary delay of over 30 seconds, a new line is inserted after all.

I also tried copying and pasting a newline, which works without any trouble.

It seems like it is a regression from my previous install (last week). Currently I am on commit 91bd783273477d.

@Wodann Wodann changed the title Pressing enter only results in inserting a new-line after more than half a minute Pressing enter only results in inserting a newline after more than half a minute May 26, 2019
@memoryruins
Copy link
Contributor

Assuming vscode, is there anything showing in the output / traces?
Was it a normal project and/or something similar to the case in #1259?

@DJMcNab
Copy link
Contributor

DJMcNab commented May 26, 2019

I sometimes get this. A temporary workaround of using ctrl+enter rather than just ctrl has worked for me.

@Wodann
Copy link
Author

Wodann commented May 26, 2019

@memoryruins Yes, it is vscode. Sorry for not mentioning that.

I had a look at issue #1259. I am not sure whether there is any difference between his project or mine. I have a workspace crate that contains four crates, which are used as dependencies amongst each other (very similar to RA's structure)

The reported error seems different from #1259 though. From what I could determine from the log, it consistently takes about 15 seconds for the server to respond to a request. Sometimes the server reports that the client cancelled a request. The reception of a response doesn't directly result in the addition of a newline. Eventually all enters are processed and cause newlines to occur at the original location of execution.

Some additional observations:

  • Before the Start watching changes with cargo? pops up, I can briefly press enter.
  • It does seem like RA is capable of "recovering" from this issue as after leaving RA unmanaged for some time it can randomly happen that enters start and keep responding directly.

This is just me hypothesizing, but it almost seems like some work is happening in the background that stalls requests. As requests start racking up, this causes further delays. When left for a while, the queue slowly empties. After this further requests can happen directly again.

Could it maybe be caused by the initial loading of modules, as that might take some time. It's weird that I can type other symbols than Enter without any issues though.

@DJMcNab Thank you! Pressing Ctrl + Enter actually works :)

The trace reports the following:

EDIT(@matklad): hide the trace under <details>

``` [Trace - 18:23:04] Sending request 'rust-analyzer/onEnter - (38)'. Params: { "textDocument": { "uri": "file:///e%3A/dev/src/se4_core/crates/se4_db/src/lib.rs" }, "position": { "line": 26, "character": 5 } }

[Trace - 18:23:16] Received response 'textDocument/codeAction - (29)' in 13268ms. Request failed: canceled by client (-32800).
[Trace - 18:23:16] Received response 'textDocument/foldingRange - (24)' in 14608ms. Request failed: canceled by client (-32800).
[Trace - 18:23:16] Received response 'textDocument/codeAction - (30)' in 12909ms. Request failed: canceled by client (-32800).
[Trace - 18:23:18] Received response 'textDocument/documentSymbol - (28)' in 16663ms.
Result: [
{
"deprecated": false,
"kind": 2,
"name": "tests",
"range": {
"end": {
"character": 12,
"line": 41
},
"start": {
"character": 0,
"line": 40
}
},
"selectionRange": {
"end": {
"character": 9,
"line": 41
},
"start": {
"character": 4,
"line": 41
}
}
},
{
"children": [
{
"deprecated": false,
"detail": "fn(&self, name: &str, user: &str, pwd: &str) -> DbResult",
"kind": 12,
"name": "auth_db",
"range": {
"end": {
"character": 5,
"line": 37
},
"start": {
"character": 4,
"line": 31
}
},
"selectionRange": {
"end": {
"character": 18,
"line": 31
},
"start": {
"character": 11,
"line": 31
}
}
},
{
"deprecated": false,
"detail": "fn(address: &str, port: u16, options: Option) -> DbResult",
"kind": 12,
"name": "connect",
"range": {
"end": {
"character": 5,
"line": 26
},
"start": {
"character": 4,
"line": 19
}
},
"selectionRange": {
"end": {
"character": 18,
"line": 19
},
"start": {
"character": 11,
"line": 19
}
}
}
],
"deprecated": false,
"kind": 19,
"name": "impl DbServer",
"range": {
"end": {
"character": 1,
"line": 38
},
"start": {
"character": 0,
"line": 18
}
},
"selectionRange": {
"end": {
"character": 13,
"line": 18
},
"start": {
"character": 5,
"line": 18
}
}
},
{
"children": [
{
"deprecated": false,
"detail": "gridfs::Store",
"kind": 8,
"name": "fs",
"range": {
"end": {
"character": 25,
"line": 15
},
"start": {
"character": 4,
"line": 15
}
},
"selectionRange": {
"end": {
"character": 10,
"line": 15
},
"start": {
"character": 8,
"line": 15
}
}
},
{
"deprecated": false,
"detail": "mongodb::db::Database",
"kind": 8,
"name": "db",
"range": {
"end": {
"character": 33,
"line": 14
},
"start": {
"character": 4,
"line": 14
}
},
"selectionRange": {
"end": {
"character": 10,
"line": 14
},
"start": {
"character": 8,
"line": 14
}
}
}
],
"deprecated": false,
"kind": 23,
"name": "DbClient",
"range": {
"end": {
"character": 1,
"line": 16
},
"start": {
"character": 0,
"line": 13
}
},
"selectionRange": {
"end": {
"character": 19,
"line": 13
},
"start": {
"character": 11,
"line": 13
}
}
},
{
"children": [
{
"deprecated": false,
"detail": "Client",
"kind": 8,
"name": "client",
"range": {
"end": {
"character": 18,
"line": 10
},
"start": {
"character": 4,
"line": 10
}
},
"selectionRange": {
"end": {
"character": 10,
"line": 10
},
"start": {
"character": 4,
"line": 10
}
}
}
],
"deprecated": false,
"kind": 23,
"name": "DbServer",
"range": {
"end": {
"character": 1,
"line": 11
},
"start": {
"character": 0,
"line": 9
}
},
"selectionRange": {
"end": {
"character": 19,
"line": 9
},
"start": {
"character": 11,
"line": 9
}
}
}
]

[Trace - 18:23:18] Received response 'textDocument/codeLens - (27)' in 16760ms.
Result: [
{
"data": {
"impls": {
"position": {
"character": 0,
"line": 9
},
"textDocument": {
"uri": "file:///e%3A/dev/src/se4_core/crates/se4_db/src/lib.rs"
}
}
},
"range": {
"end": {
"character": 1,
"line": 11
},
"start": {
"character": 0,
"line": 9
}
}
},
{
"data": {
"impls": {
"position": {
"character": 0,
"line": 13
},
"textDocument": {
"uri": "file:///e%3A/dev/src/se4_core/crates/se4_db/src/lib.rs"
}
}
},
"range": {
"end": {
"character": 1,
"line": 16
},
"start": {
"character": 0,
"line": 13
}
}
}
]

[Trace - 18:23:18] Received response 'textDocument/codeLens - (26)' in 16762ms.
Result: [
{
"data": {
"impls": {
"position": {
"character": 0,
"line": 9
},
"textDocument": {
"uri": "file:///e%3A/dev/src/se4_core/crates/se4_db/src/lib.rs"
}
}
},
"range": {
"end": {
"character": 1,
"line": 11
},
"start": {
"character": 0,
"line": 9
}
}
},
{
"data": {
"impls": {
"position": {
"character": 0,
"line": 13
},
"textDocument": {
"uri": "file:///e%3A/dev/src/se4_core/crates/se4_db/src/lib.rs"
}
}
},
"range": {
"end": {
"character": 1,
"line": 16
},
"start": {
"character": 0,
"line": 13
}
}
}
]

[Trace - 18:23:18] Received response 'codeLens/resolve - (25)' in 16762ms. Request failed: canceled by client (-32800).
[Trace - 18:23:18] Received response 'textDocument/foldingRange - (31)' in 14816ms.
Result: [
{
"endCharacter": 0,
"endLine": 5,
"kind": "imports",
"startCharacter": 0,
"startLine": 2
},
{
"endCharacter": 20,
"endLine": 11,
"startCharacter": 20,
"startLine": 9
},
{
"endCharacter": 20,
"endLine": 16,
"startCharacter": 20,
"startLine": 13
},
{
"endCharacter": 14,
"endLine": 35,
"startCharacter": 14,
"startLine": 18
},
{
"endCharacter": 99,
"endLine": 26,
"startCharacter": 99,
"startLine": 19
},
{
"endCharacter": 83,
"endLine": 34,
"startCharacter": 83,
"startLine": 28
}
]

[Trace - 18:23:18] Received response 'textDocument/codeLens - (33)' in 14768ms.
Result: [
{
"data": {
"impls": {
"position": {
"character": 0,
"line": 9
},
"textDocument": {
"uri": "file:///e%3A/dev/src/se4_core/crates/se4_db/src/lib.rs"
}
}
},
"range": {
"end": {
"character": 1,
"line": 11
},
"start": {
"character": 0,
"line": 9
}
}
},
{
"data": {
"impls": {
"position": {
"character": 0,
"line": 13
},
"textDocument": {
"uri": "file:///e%3A/dev/src/se4_core/crates/se4_db/src/lib.rs"
}
}
},
"range": {
"end": {
"character": 1,
"line": 16
},
"start": {
"character": 0,
"line": 13
}
}
}
]

[Trace - 18:23:18] Received response 'textDocument/codeLens - (35)' in 14765ms.
Result: [
{
"data": {
"impls": {
"position": {
"character": 0,
"line": 9
},
"textDocument": {
"uri": "file:///e%3A/dev/src/se4_core/crates/se4_db/src/lib.rs"
}
}
},
"range": {
"end": {
"character": 1,
"line": 11
},
"start": {
"character": 0,
"line": 9
}
}
},
{
"data": {
"impls": {
"position": {
"character": 0,
"line": 13
},
"textDocument": {
"uri": "file:///e%3A/dev/src/se4_core/crates/se4_db/src/lib.rs"
}
}
},
"range": {
"end": {
"character": 1,
"line": 16
},
"start": {
"character": 0,
"line": 13
}
}
}
]

[Trace - 18:23:18] Received response 'rust-analyzer/onEnter - (37)' in 14589ms.
No result returned.

[Trace - 18:23:18] Received response 'rust-analyzer/onEnter - (38)' in 14357ms.
No result returned.

</details>

@DJMcNab
Copy link
Contributor

DJMcNab commented May 26, 2019

No problem! I'm afraid I can't really help with the underlying issue.

@matklad
Copy link
Member

matklad commented May 27, 2019

It's a know problem, I hope to look into this soon.

The crux of the issue is that we don't implement any kind of request prioritization, so things like "handle enter" could be blocked on the background analysis

@matklad matklad self-assigned this May 27, 2019
bors bot added a commit that referenced this issue May 27, 2019
1334: check for cancellation during macro expansion r=matklad a=matklad

closes #1331

Co-authored-by: Aleksey Kladov <[email protected]>
@bors bors bot closed this as completed in #1334 May 27, 2019
@sophiajt
Copy link

@matklad - I'm still seeing this issue with the latest rust-analyzer

@matklad matklad reopened this May 29, 2019
@kiljacken
Copy link
Contributor

I'm also experiencing this issue quite commonly. Will gladly help if pointed in the right direction :)

@matklad
Copy link
Member

matklad commented May 29, 2019

@kiljacken the steps to handle this problem:

  • find out why it is slow, by inserting profile("foo") calls
  • write a heavy test that shows the issue
  • implement a fix

#1334 contains all those steps

Docs for our profiling infra are here: https://github.com/rust-analyzer/rust-analyzer/blob/master/docs/dev/README.md#profiling

@matklad
Copy link
Member

matklad commented May 29, 2019

To clarify, on the high level, the problem isn't that handling Enter is slow, the problem is that handling Enter is blocked on some other stuff, and we should make sure that "other stuff" is properly canceled or does not block high-priority operations in the first place.

Another pointer would be our main loop:

https://github.com/rust-analyzer/rust-analyzer/blob/9eef546ca2f59d0ebc0e5dc443fc1a5d93926030/crates/ra_lsp_server/src/main_loop.rs#L172

Here, you can see on the highest level the order and timings of various events.

@matklad
Copy link
Member

matklad commented May 29, 2019

Also, setting rust-analyzer.enableEnhancedTyping: false in the settings should completely disable our hijacking of enter to work around the issue, but we really should fix this: ability to features, which blocks user typing, fast enough is important to have in excellent language server :)

@ghost
Copy link

ghost commented May 29, 2019

I also started experiencing this a couple of days ago. The one thing that a text editor should be able to do flawlessly is handle my keystrokes, so needless to say, it's very frustrating when it does not. I can confirm that the issue is present on commit 854dac3. I haven't yet tried whether the issue persists with #1334 or with rust-analyzer.enableEnhancedTyping: false.

@matklad
Copy link
Member

matklad commented May 29, 2019

I've looked into this, and, while I can't reproduce mulit-seconds hangs after #1334, I've fixed a couple of potential problems:

#1341

#1343

  • we now have better perf logging in our main loop. We also show timings for the last ten requests in the status page:

image

(onEnter is the request this issue is about)

  • preveously, we tried to run GC before each request, which doens't make much sense. Now we GC after we've send a response

  • we now try to cancel pending background tasks when handling realtime requests like on Enter

I wonder if folks still can reproduce the problem after cb21a21

@sophiajt
Copy link

Yes, I can still reproduce it. If you open https://github.com/wycats/nushell and open src/commands/split.rs, try to hit enter towards the top of the file. Especially if you tell it to run cargo check, I'm seeing pretty long delays after hitting enter. Sometimes the delays are multiple seconds.

@sophiajt
Copy link

I'm also looking at the "Rust Analyzer Language Server Trace" and don't see any output like you mention above. It's possible I'm not installing something correctly? I've been using cargo install-lsp followed by cargo install-code.

@matklad
Copy link
Member

matklad commented May 29, 2019

and don't see any output like you mention above.

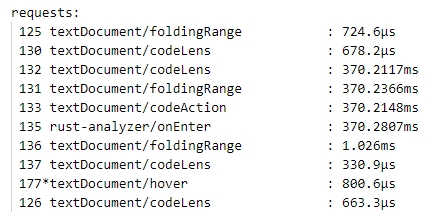
The screenshot is from Rust Analyzer: Status VS Code command.

The hierarchical profiling is printed only if you set RA_PROFILE env var. RA_PROFILE=*>16 should show everything longer than 16 milliseconds.

@sophiajt
Copy link

image

That's some of my numbers, though I'm definitely seeing delays longer than 1/3rd of a second.

@sophiajt
Copy link

image

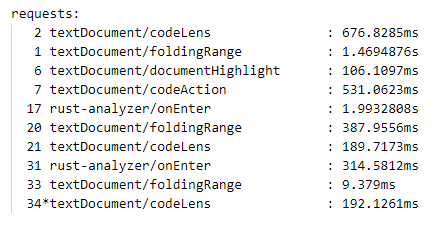
This is more like it. These are the numbers I see on a fresh startup.

@lnicola
Copy link
Member

lnicola commented May 29, 2019

Just wondering, can a user request trigger a long-running computation (due to the lazy nature of RA) that isn't attributed properly in the profiler?

EDIT: E.g. I open a file and the highlighter wants semanatic information, which triggers analysis of most of the code in the project, and bad luck if you're opening it from a network share.

@matklad
Copy link
Member

matklad commented May 29, 2019

Just wondering, can a user request trigger a long-running computation (due to the lazy nature of RA) that isn't attributed properly in the profiler?

That is possible, though most of the stuff should be profiled. The notable thing which takes time, but is not present in the profile is salsa's overhead for validation, see https://salsa.zulipchat.com/#narrow/stream/145099-general/topic/Some.20Profiling.20data/near/166644275.

Though ideally this shouldn't be a problem. Rust Analyzer is explicitly architectured with arbitrary-long background computations in mind, so what should happen in this case is that, while one thread computes long-running task, another thread handles on-enter. After that, the client sends changes from on-enter, and the long-running task is automatically canceled.

But, as we clearly from profile data, the theory does not work in practice :D

My next hypothesis is that we handle onEnter asynchronously, so we recieve request and send response on different event loop turns, and something in between blocks the event loop. I'll try to handle onEnter synchronously, on the same turn of the event loop: really, there's no reason to offload it to background thread, and this naturally gives us that "task prioritization" I alluded to before.

@matklad
Copy link
Member

matklad commented May 29, 2019

and something in between blocks the event loop

Found it! It's salsa!

Specifically, what I am seeing is this:

        136ms - diagnostics
            131ms - crate_def_map_query
                131ms - collect_defs
                    131ms - collect_defs/populate-prelude
                        131ms - crate_def_map_query
                            131ms - collect_defs
                                131ms - collect_defs/populate-prelude
              3ms - parse_query (1 calls)
        118ms - main_loop_inner/loop-turn
            118ms - RootDatabase::apply_change
                118ms - RootDatabase::apply_change/cancellation

diagnostics kick in after a change and compute name resolution. We see that something has changed, so we kick nameres for the current crate (which, really shouldn't be the case I think for adding a blank like, but that's a separate issue). That name res kicks resolution of other crates, notably of std, in collect_defs/populate-prelude. Not however that this is the leaf entry of profiling three! That means that 131 milliseconds are spend entirely inside salsa, to verify that nothing has changed. And the problem here is that we can't cancel verification process, so wee need to spend the whole of 131 milliseconds. That's why RootDatabase::apply_change/cancellation takes 118ms as well: it blocks waiting for that non-cancellable block inside diagnostics to finish.

@matklad
Copy link
Member

matklad commented May 29, 2019

which, really shouldn't be the case I think for adding a blank like, but that's a separate issue

The reason for that is if we happen to cancel a subquery when the parent query is validated, we completely remove the parent query, instead of marking it as not-validated

@DJMcNab
Copy link
Contributor

DJMcNab commented May 29, 2019

Is there an issue in Salsa to track this slowness?

Edit: or, if it is unavoidable (which I doubt based on your comment), to discuss what we can do to make it better on our end.

@matklad
Copy link
Member

matklad commented May 30, 2019

Closed by #1348, I hope 😅

If you still see hangs after that, please reopen :-)

Is there an issue in Salsa to track this slowness?

no, but I've found a work-around, and we are discussing stuff in Zulip:

https://salsa.zulipchat.com/#narrow/stream/145099-general/topic/Some.20Profiling.20data and https://salsa.zulipchat.com/#narrow/stream/184114-rfcs.2Fdrafts-and-proposals/topic/mutable.20constants

@matklad matklad closed this as completed May 30, 2019
@sophiajt
Copy link

Still seeing it.

image

and

image

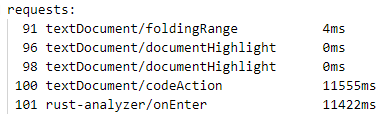
To repro, if you open the project above, enable "cargo watch" and then press enter inside the file while analysis is running.

@lnicola
Copy link
Member

lnicola commented May 30, 2019

On my laptop nothing else works fine while cargo check is running. Not even my mouse cursor, at times.

@matklad
Copy link
Member

matklad commented May 30, 2019

@jonathandturner what happens if you disable cargo watch though? cargo watch just runs Cargo in the background, and I imagine that can, by default, consume all CPUs....

@sophiajt
Copy link

Without cargo watch:

image

and

image

@matklad matklad reopened this May 30, 2019
@jminer
Copy link

jminer commented May 30, 2019

I'm not using cargo watch, and I've had a few times that pressing enter felt really slow (I updated rust-analyzer today for the first time in a couple months). The most recent time:

requests:
 842 textDocument/completion             354ms
 849 textDocument/foldingRange           652ms
 850 textDocument/codeAction             652ms
 851 rust-analyzer/onEnter               652ms
 852*textDocument/foldingRange           1ms
 835 textDocument/completion             155ms
 836 textDocument/completion             150ms
 837 textDocument/foldingRange           0ms
 838 textDocument/completion             411ms
 839 textDocument/foldingRange           1ms

Edit: another time that seemed like 5 to 10 seconds:

requests:
1758 textDocument/completion             2787ms
1779 textDocument/completion             1490ms
1794 textDocument/foldingRange           1846ms
1797 rust-analyzer/onEnter               1842ms
1798*textDocument/foldingRange           1ms
1745 textDocument/foldingRange           1ms
1746 textDocument/codeAction             50ms
1747 textDocument/foldingRange           0ms
1748 textDocument/codeAction             131ms
1749 textDocument/foldingRange           1ms

@matklad
Copy link
Member

matklad commented Jun 11, 2019

Status update:

I still haven't looked closely into this particular issue, as I can't get a reproduction on a local machine.

My current thoughts:

  • this could be caused by GC (which is stop-the-world at the moment). LRU work should help here, and we could move GC off the event-loop thread
  • pauses during initial load of the project could be caused by overloading system initially or loading things in non-optimal order (libraries before the main code). But the above traces show pauses after initial load
  • maybe we are just overloading the whole system with too many threads (this shouldn't be the issue though, if threads don't block each other)
  • a though that occurred to me right now: I am testing this on a laptop with SSD, I wonder if spinning disks drastically change the latency picture here

@matklad
Copy link
Member

matklad commented Jun 13, 2019

Status update: @jminer and @lnicola discovered that this is a windows specific issues, caused by the fact that our cancellation mechanism triggers collection of backtraces. I am pushing a hot-fix for this in #1401 (basically, don't force backtrace), the proper solution is presumably #1400 (we need to verify though that just panic::resume_unwind does not trigger backtrace)

@bjorn3
Copy link
Member

bjorn3 commented Jun 13, 2019

we need to verify though that just panic::resume_unwind does not trigger backtrace

It doesn't print anything, so no backtrace either. I used it in compiletest (rust-lang/rust#59990) to prevent the unnecessary panic message when a test failed.

@matklad
Copy link
Member

matklad commented Jun 15, 2019

Ok, as an old Russian tale goes,

For the third time Alyosha has closed the issue

If you are still seeing this, please reopen :)

@scambier
Copy link

There's a 5 seconds lag between pressing enter and having the new line inserted. It's also related to #3212 because I had the "Command 'rust-analyzer.onEnter' not found" message when I deactivated rust-analyzer to check if it was the culprit.

That binding is automatically added so I can't remove it, even after having deactivated rust-analyzer, and even after reloading VSCode in safe mode!. I had to close VSCode and edit my keybdings.json in Sublime Text. All that so I can get rid of that latency :/

@flodiebold
Copy link
Member

The onEnter command hasn't been automatically added for more than 2 years. What version of the extension do you have installed?

@scambier
Copy link

VSCode says v0.3.1123

@flodiebold
Copy link
Member

Well, that's up to date. Maybe you started out with a very old version?

@scambier
Copy link

I checked, and my oldest rust work dates from Jan/Feb 2021. So let's say not sooner than late 2020 🤷‍♂️

I guess I'm good for some deep cleaning and reinstallations?

@flodiebold
Copy link
Member

Probably.

@scambier
Copy link

Well, the issue went away after a clean uninstall. No idea what was causing it though :/

Sign up for free to join this conversation on GitHub. Already have an account? Sign in to comment
Labels
None yet
Projects
None yet
Development

Successfully merging a pull request may close this issue.