Closed
Description
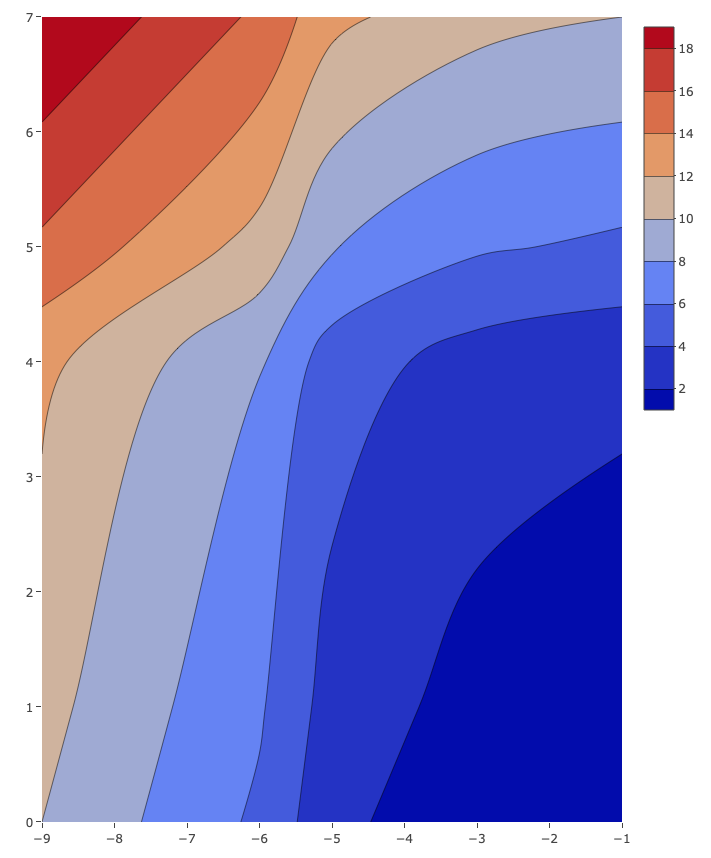
When plotting a contour plot, the colorscale attribute is either standard, when it is not set (green-purple) or red-blue, when any attribute is set.
 plot_ly(
  x = c(-9, -6, -5, -3, -1),
  y = c(0, 1, 4, 5, 7),
  z = matrix(c(10, 10.625, 12.5, 15.625, 20, 5.625, 6.25, 8.125, 11.25, 15.625, 2.5, 3.125, 5, 8.125, 12.5, 0.625, 1.25, 3.125,
               6.25, 10.625, 0, 0.625, 2.5, 5.625, 10), nrow = 5, ncol = 5),
  type = "contour",
  colorscale='jennifer'
)
results in red-blue
 plot_ly(
  x = c(-9, -6, -5, -3, -1),
  y = c(0, 1, 4, 5, 7),
  z = matrix(c(10, 10.625, 12.5, 15.625, 20, 5.625, 6.25, 8.125, 11.25, 15.625, 2.5, 3.125, 5, 8.125, 12.5, 0.625, 1.25, 3.125,
               6.25, 10.625, 0, 0.625, 2.5, 5.625, 10), nrow = 5, ncol = 5),
  type = "contour",
  colorscale='Rainbow'
)
same result again.
I could not identify the cause of this problem. There has to be some kind of fallback default.
Versions used: plotly 4.8.0,
platform x86_64-apple-darwin15.6.0
arch x86_64
os darwin15.6.0
system x86_64, darwin15.6.0
status
major 3
minor 5.1
year 2018
month 07
day 02
svn rev 74947
language R
version.string R version 3.5.1 (2018-07-02)
nickname Feather Spray