Skip to content

geom_line becomes invisible when color aesthetic applied #1387

New issue

Have a question about this project? Sign up for a free GitHub account to open an issue and contact its maintainers and the community.

By clicking “Sign up for GitHub”, you agree to our terms of service and privacy statement. We’ll occasionally send you account related emails.

Already on GitHub? Sign in to your account

Open
wolfeclw opened this issue Nov 1, 2018 · 1 comment
Open

geom_line becomes invisible when color aesthetic applied #1387

wolfeclw opened this issue Nov 1, 2018 · 1 comment

Comments

@wolfeclw
Copy link

wolfeclw commented Nov 1, 2018

I am attempting to apply a gradient color scale to a line in a ggplot object. When I create the plotly chart, the plotted line is not visible. Hovering over the plot area shows the values of the variables if the cursor is where the line is located, even though the line is not visible.

If I do not apply a color aesthetic, the line is visible.

I have download the most recent plotly package from Github.

Here is some example code of the issue:

library(tidyverse)

df <- tibble(
x = rnorm(100, 7, 1),
y = rnorm(100, 4, 1),
z = rnorm(100, 5, 1))

plot <- ggplot(df) +
geom_line(aes(x, y, color = z),
lwd = 1.5) +
scale_color_gradient(low = "red",
high = "blue")

plot

plotly::plotly_build(plot)
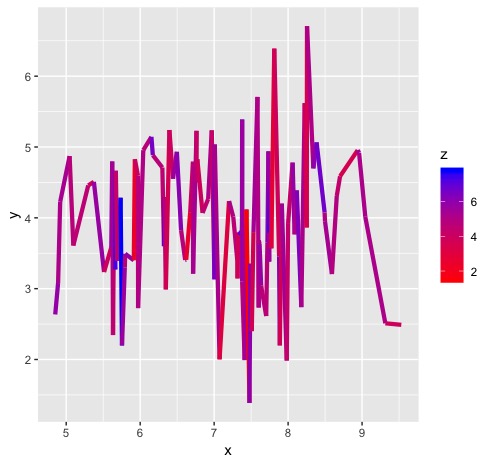
ggplot:
ggplot_ex

plotly_ex

@cpsievert
Copy link
Collaborator

cpsievert commented Nov 1, 2018

As mentioned in plotly/plotly.js#3205 (comment) plotly.js plans on implementing color/width arrays in scattergl, so we should leverage that when the time comes.

It might make sense to have a general routine that switches scatter to scattergl (with a message/warning?) if line.color or line.width is an array

Sign up for free to join this conversation on GitHub. Already have an account? Sign in to comment
Projects
None yet
Development

No branches or pull requests

2 participants