debug: Long strings in debugger get truncated #1318
Comments
|
Even though not very ideal, how about https://github.com/golang/vscode-go/blob/master/docs/debugging.md#configuration |
|
@hyangah Oh I see. I have to admit I skimmed that issue and just noticed at the bottom that it was closed as fixed. I didn't realize that's how they fixed it. I tried setting it to 10000 characters, which should suit my needs, and it worked well. It still doesn't display the full string in the debugging part of the UI (it has Speaking of skimming, I think the fact that I tend to skim through documentation these days is why I missed that instruction in the debugging section of the Go extension documentation. I have experience with multiple programming languages for a few years now, so I tend to assume certain things work the same way, like "this is how one declares a variable", "this is how one starts a debugging session", "this is how one observes the value of the variable while debugging", and with the Go extension, it seems that 3rd example is done differently compared to other languages I've used with VS Code. For example, with JavaScript debugging in VS Code, I don't recall ever encountering this problem. I'm thinking that a better default setting would be to display a much longer version of the string. I understand that it may not be good for performance to display the entire string every time. But I feel like the current low limit is too low. If performance is a concern, we probably only need to protect the UI's performance from exceptionally long strings, like when someone has a loop and appends to a string making it very long. If it isn't possible to change the default to be longer, I think something more discoverable would be nice. Maybe something in the UI people can click on to see the full string while they're debugging. I think JetBrains IDEs do it this way. I recall using GoLand and being able to see the full value of my big JSON strings representing data flowing through the program (usually up 10000 characters). I don't recall if they displayed that many characters automatically or if I had to click some sort of "see more". |
|
@mattwelke thanks for sharing the ideas. I agree that the current state is not ideal. (Maybe at least we can apply longer limit for the Evaluate Request coming from Debug Console) I don't know how the current default value was chosen though - some users found large limits affect the performance too much |
|
@hyangah I like the idea of the longer default limit for evaluate requests coming from the debug console. It's an explicit action from the user, so it's less likely to get in the way and cause performance problems. There's another ticket we're communicating on related to Go debugging. It's clear to me now that if I want to get deeper into helping with Go debugging, I need to get more familiar with tools like Delve and DAP. I'll revisit this once I've had a chance to do so. :) ty |
|
The current default is the default in the dlv backend. You can change the limit, but you can't tell delve to load an entire string of arbitrary length at once. Dlv has built-in loading limits for other types as well. Dlv-dap can auto-load interfaces, but not other types yet. For strings, we could display the truncated string value by default, but offer an option to expand like we do with compound vars. The expansion would trigger another variables request, which will tell the adapter to load more of the string. At that point, we can either load the entire string chunk by chunk in a loop or change the str limit in dlv, load the whole string, then change the str limit back to the default value. That whole large string would need to be written into a single variables response. Maybe there can be an intermediate partial expansion for really really large values. We can easily use different default limits for values plugged into the Debug Console. They will also affect WATCH and Copy Value options as those also map to EvaluateRequest. Debug Adapter Protocol has some fields for "paging of variables", but I don't know if vscode editor actually supports that. But even so, it doesn't sound like this is what is desired here. Having to load thousands of characters in small chunks can get rather annoying. |
We get
It would make a lot of sense to use a larger string limit when doing (1) and (2), but not (3). |
When evaluate requests are triggered in the context of 'repl'
(DEBUG CONSOLE in VSCode) or 'variables' (copy values from VARIABLES
section in VSCode), they are the result of human action and have
more rooms to display. So it is not too bad to apply longer limits.

Variable auto-loading for strings or arrays is nice but currently
it's unclear to me how this should be integrated in the DEBUG
CONSOLE or with the Copy Value feature. Until we have better ideas
and tools, let's go with these larger limits.

Unfortunately, the "Copy Value" from WATCH section triggers evaluate
requests with "watch" context and we don't want to load large data
automatically for "watch". So, users who want to query a large value
should first copy the expression to DEBUG CONSOLE and evaluate it.
Not ideal but not the end of the world either.

Updates golang/vscode-go#1318
|
This doesn't work for me with dlv-dap "go.delveConfig": {
"dlvLoadConfig": {
"followPointers": true,
"maxVariableRecurse": 1,
"maxStringLen": 300,
"maxArrayValues": 64,
"maxStructFields": -1
},
"apiVersion": 2,
"showGlobalVariables": false,
"debugAdapter": "dlv-dap"
}
EDIT: It's covered in the readme. Legacy works fine: https://github.com/golang/vscode-go/blob/ec0853077c347e3250ff40ac48eaed8daaae4c94/docs/dlv-dap.md |

|
Yes, These setting are not available in dlv-dap. Please see the discussion at go-delve/delve#2144. We will be looking into ways to load these on demand in dlv-dap. |
…s' context (#2418)

* dap: use larger variable load limits in 'repl', 'variables' context

When evaluate requests are triggered in the context of 'repl'
(DEBUG CONSOLE in VSCode) or 'variables' (copy values from VARIABLES
section in VSCode), they are the result of human action and have
more rooms to display. So it is not too bad to apply longer limits.

Variable auto-loading for strings or arrays is nice but currently
it's unclear to me how this should be integrated in the DEBUG
CONSOLE or with the Copy Value feature. Until we have better ideas
and tools, let's go with these larger limits.

Unfortunately, the "Copy Value" from WATCH section triggers evaluate
requests with "watch" context and we don't want to load large data
automatically for "watch". So, users who want to query a large value
should first copy the expression to DEBUG CONSOLE and evaluate it.
Not ideal but not the end of the world either.

Updates golang/vscode-go#1318

* dap: apply large limit only to the string type result

* dap: move string reload logic to convertVariable* where other reload logic is

Currently we are thinking string reload for evaluation as a temporary
workaround until we figure out an intutitive way to present long strings.
So, I hope moving this logic near other reload logic may be better.

And, use the address based expression when reloading - when handling the
function return values, we may not have an expression to use.

* dap: make deep source check happy

* dap: move string reevaluation logic back to onEvaluateRequest

Reloading string variables is tricky if they are in registers.
We don't attempt to reload them but for clarity, move this up
to the onEvaluateRequest handler.

For function call, use a generous limit for string load
since the results are volatile.

* dap: check variable isn't affected by evaluate in other context
|
Go to this settings on VSCode |

|
I added those settings to my VS Code config and ran the debugger again, but it had no effect. However, I do see a popup in the bottom right warning me that it won't have an effect. Before:
After:
|

|
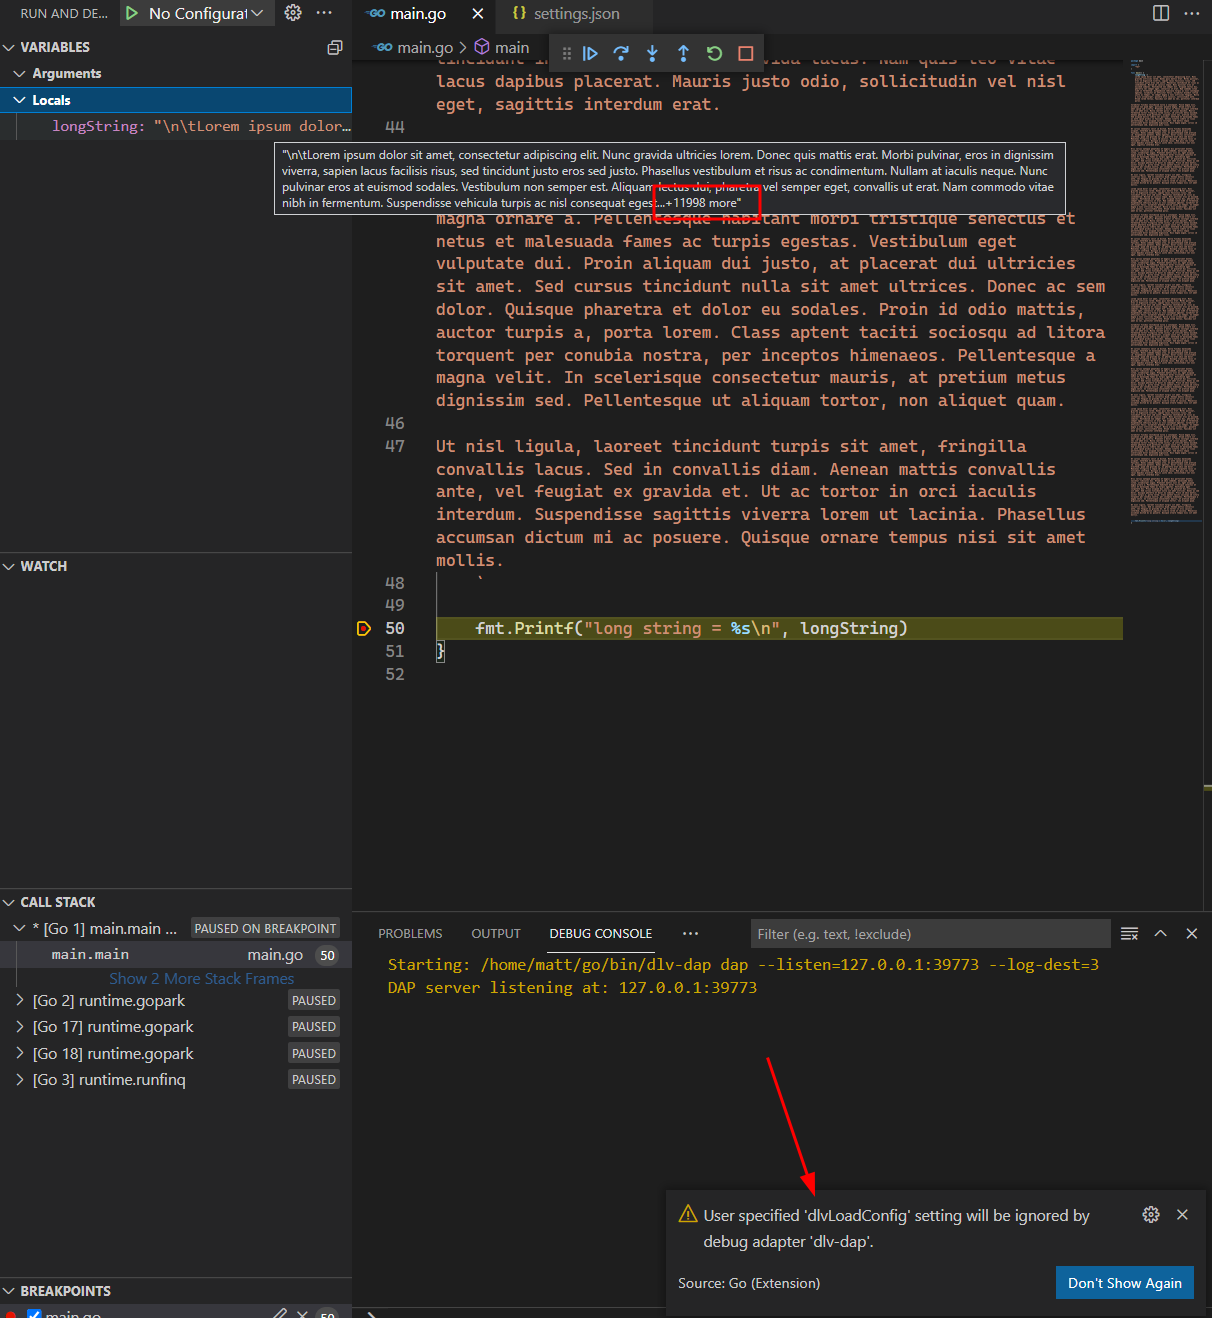
I was able to solve the popup in the bottom right using the instructions in the accepted answer at https://stackoverflow.com/questions/68732514/user-specified-dlvloadconfig-setting-will-be-ignored-by-debug-adapter-dlv-dap. But then the string doesn't appear correctly under VARIABLES while debugging:
The only whitespace is a new line and a tab before the characters:
I'm able to see the string contents if I make sure there's no white space before the non-whitespace characters of my string, but it does still get truncated in the hover preview:
|


|
@mattwelke, please instead see the stackoverflow answer on the bottom from Hana, who is one of the maintainers of vscode-go. We are currently transitioning from the legacy adapter ( The dlv-dap adapter ignores
If these automated limits are not sufficient for your case, please let us know. As for the rendering of the newline, you have come across the difference in how this is handled in the legacy adapter vs the new dlv-dap adapter. This difference is not related to |
Expands the warning and adds FAQ entry.

Updates #1318

Change-Id: Idb74b855d1d7efed997a2b3e7f42127fed2ca8be
GitHub-Last-Rev: 5153c1b
GitHub-Pull-Request: #1715
Reviewed-on: https://go-review.googlesource.com/c/vscode-go/+/344370
Reviewed-by: Hyang-Ah Hana Kim <[email protected]>
Reviewed-by: Suzy Mueller <[email protected]>
Trust: Hyang-Ah Hana Kim <[email protected]>
Run-TryBot: Hyang-Ah Hana Kim <[email protected]>
TryBot-Result: kokoro <[email protected]>
…ication

Expands the warning and adds FAQ entry.

Updates #1318

Change-Id: Iecefad6a85c27978c3c25ff9c286e5d37192eaad
GitHub-Last-Rev: 5153c1b
GitHub-Pull-Request: #1715
Reviewed-on: https://go-review.googlesource.com/c/vscode-go/+/344370
Reviewed-by: Hyang-Ah Hana Kim <[email protected]>
Reviewed-by: Suzy Mueller <[email protected]>
Trust: Hyang-Ah Hana Kim <[email protected]>
Run-TryBot: Hyang-Ah Hana Kim <[email protected]>
TryBot-Result: kokoro <[email protected]>
(cherry picked from commit ebd07b1)
Reviewed-on: https://go-review.googlesource.com/c/vscode-go/+/346093
|
dlv-dap has been the default debug adapter for a while. @polinasok summarized the current status and limit in #1318 (comment). (thanks!) If those limits are not sufficient, please open a new issue and what context you want to inspect long strings. Note though, as @polinasok explained, variables pane value via hover cannot display more than 1024 due to editor's limit even we increase the default or allow users to configure the limit. Closing. |
Uh oh!
There was an error while loading. Please reload this page.
Duplicate issues: #645, #1451
Please answer these questions before submitting your issue. Thanks!
What version of Go, VS Code & VS Code Go extension are you using?
go versionto get version of Go from the VS Code integrated terminal.go version go1.16 linux/amd64gopls -v versionto get version of Gopls from the VS Code integrated terminal.golang.org/x/tools/gopls v0.6.6code -vorcode-insiders -vto get version of VS Code or VS Code Insiders.1.54.1v0.23.2Go: Locate Configured Go ToolscommandShare the Go related settings you have added/edited
Run
Preferences: Open Settings (JSON)command to open your settings.json file.Share all the settings with the
go.or["go"]orgoplsprefixes.(none)
Describe the bug
This issue seems to have resurfaced. It was filed as an issue in the old repo managed by Microsoft and then closed as fixed: microsoft/vscode-go#868
I'm experiencing truncated strings while debugging.
Here it happens when I move my mouse over an error. I'd like to read the entire error (error messages in Go can get quite deep when they're returned from a deep layer of code) but I can't see the root error:
Steps to reproduce the behavior:
The text was updated successfully, but these errors were encountered: