runtime: mark termination is slow to restart mutator #45894
Description
What version of Go are you using (go version)?
Most of the data I have is from go1.15.6.
Does this issue reproduce with the latest release?
Yes, I have seen the same effect (as viewed from execution traces) in an app that uses go1.16.3.
What operating system and processor architecture are you using (go env)?
GOOS=linux and GOARCH=amd64
What did you do?
I have an app that uses go1.15.6 on machines with 96 hyperthreads (GOMAXPROCS=96), and an app that uses go1.16.3 on machines with 36 hyperthreads (GOMAXPROCS=36).
What did you expect to see?
I expected the app's goroutines to resume work immediately after the runtime declares end of the mark termination stop-the-world phase. I expected processors to resume work one at a time, staggered by at most a few tens of microseconds, with dozens of threads resuming useful work every millisecond.
What did you see instead?
I see in execution traces that these applications are slow to resume useful work at the end of the garbage collector's mark phase. The application using Go 1.15 and 96-hyperthread machines has a particularly low latency goal (tail of a few milliseconds), and the slow resumption of work introduces about 5 to 10ms of extra idle time during each GC run.
My read of the traces, of profiles from perf, and the runtime source is that although runtime.gcMarkDone prepares goroutines to run (in large part by injecting the Gs that were blocked on assist credit into the global run queue) and runtime.gcMarkTermination restarts the world (so Ps can pick up and execute Gs), the gcMarkTermination function follows that up immediately by using runtime.forEachP to call runtime.mcache.prepareForSweep.
When the goroutine that's finishing up the mark phase calls runtime.forEachP, it has only recently allowed the world to restart, so most Ps are still idle. That function obtains runtime.sched.lock and holds onto it while iterating the list of idle Ps, and calling the provided function for each one. My understanding of sched.lock is that it guards access to the global goroutine run queue (among other things) -- and that in the two applications where I've seen this effect, nearly every goroutine in the program that would be runnable is sitting in the global run queue since nearly all of them became blocked on assist credit during the mark phase.
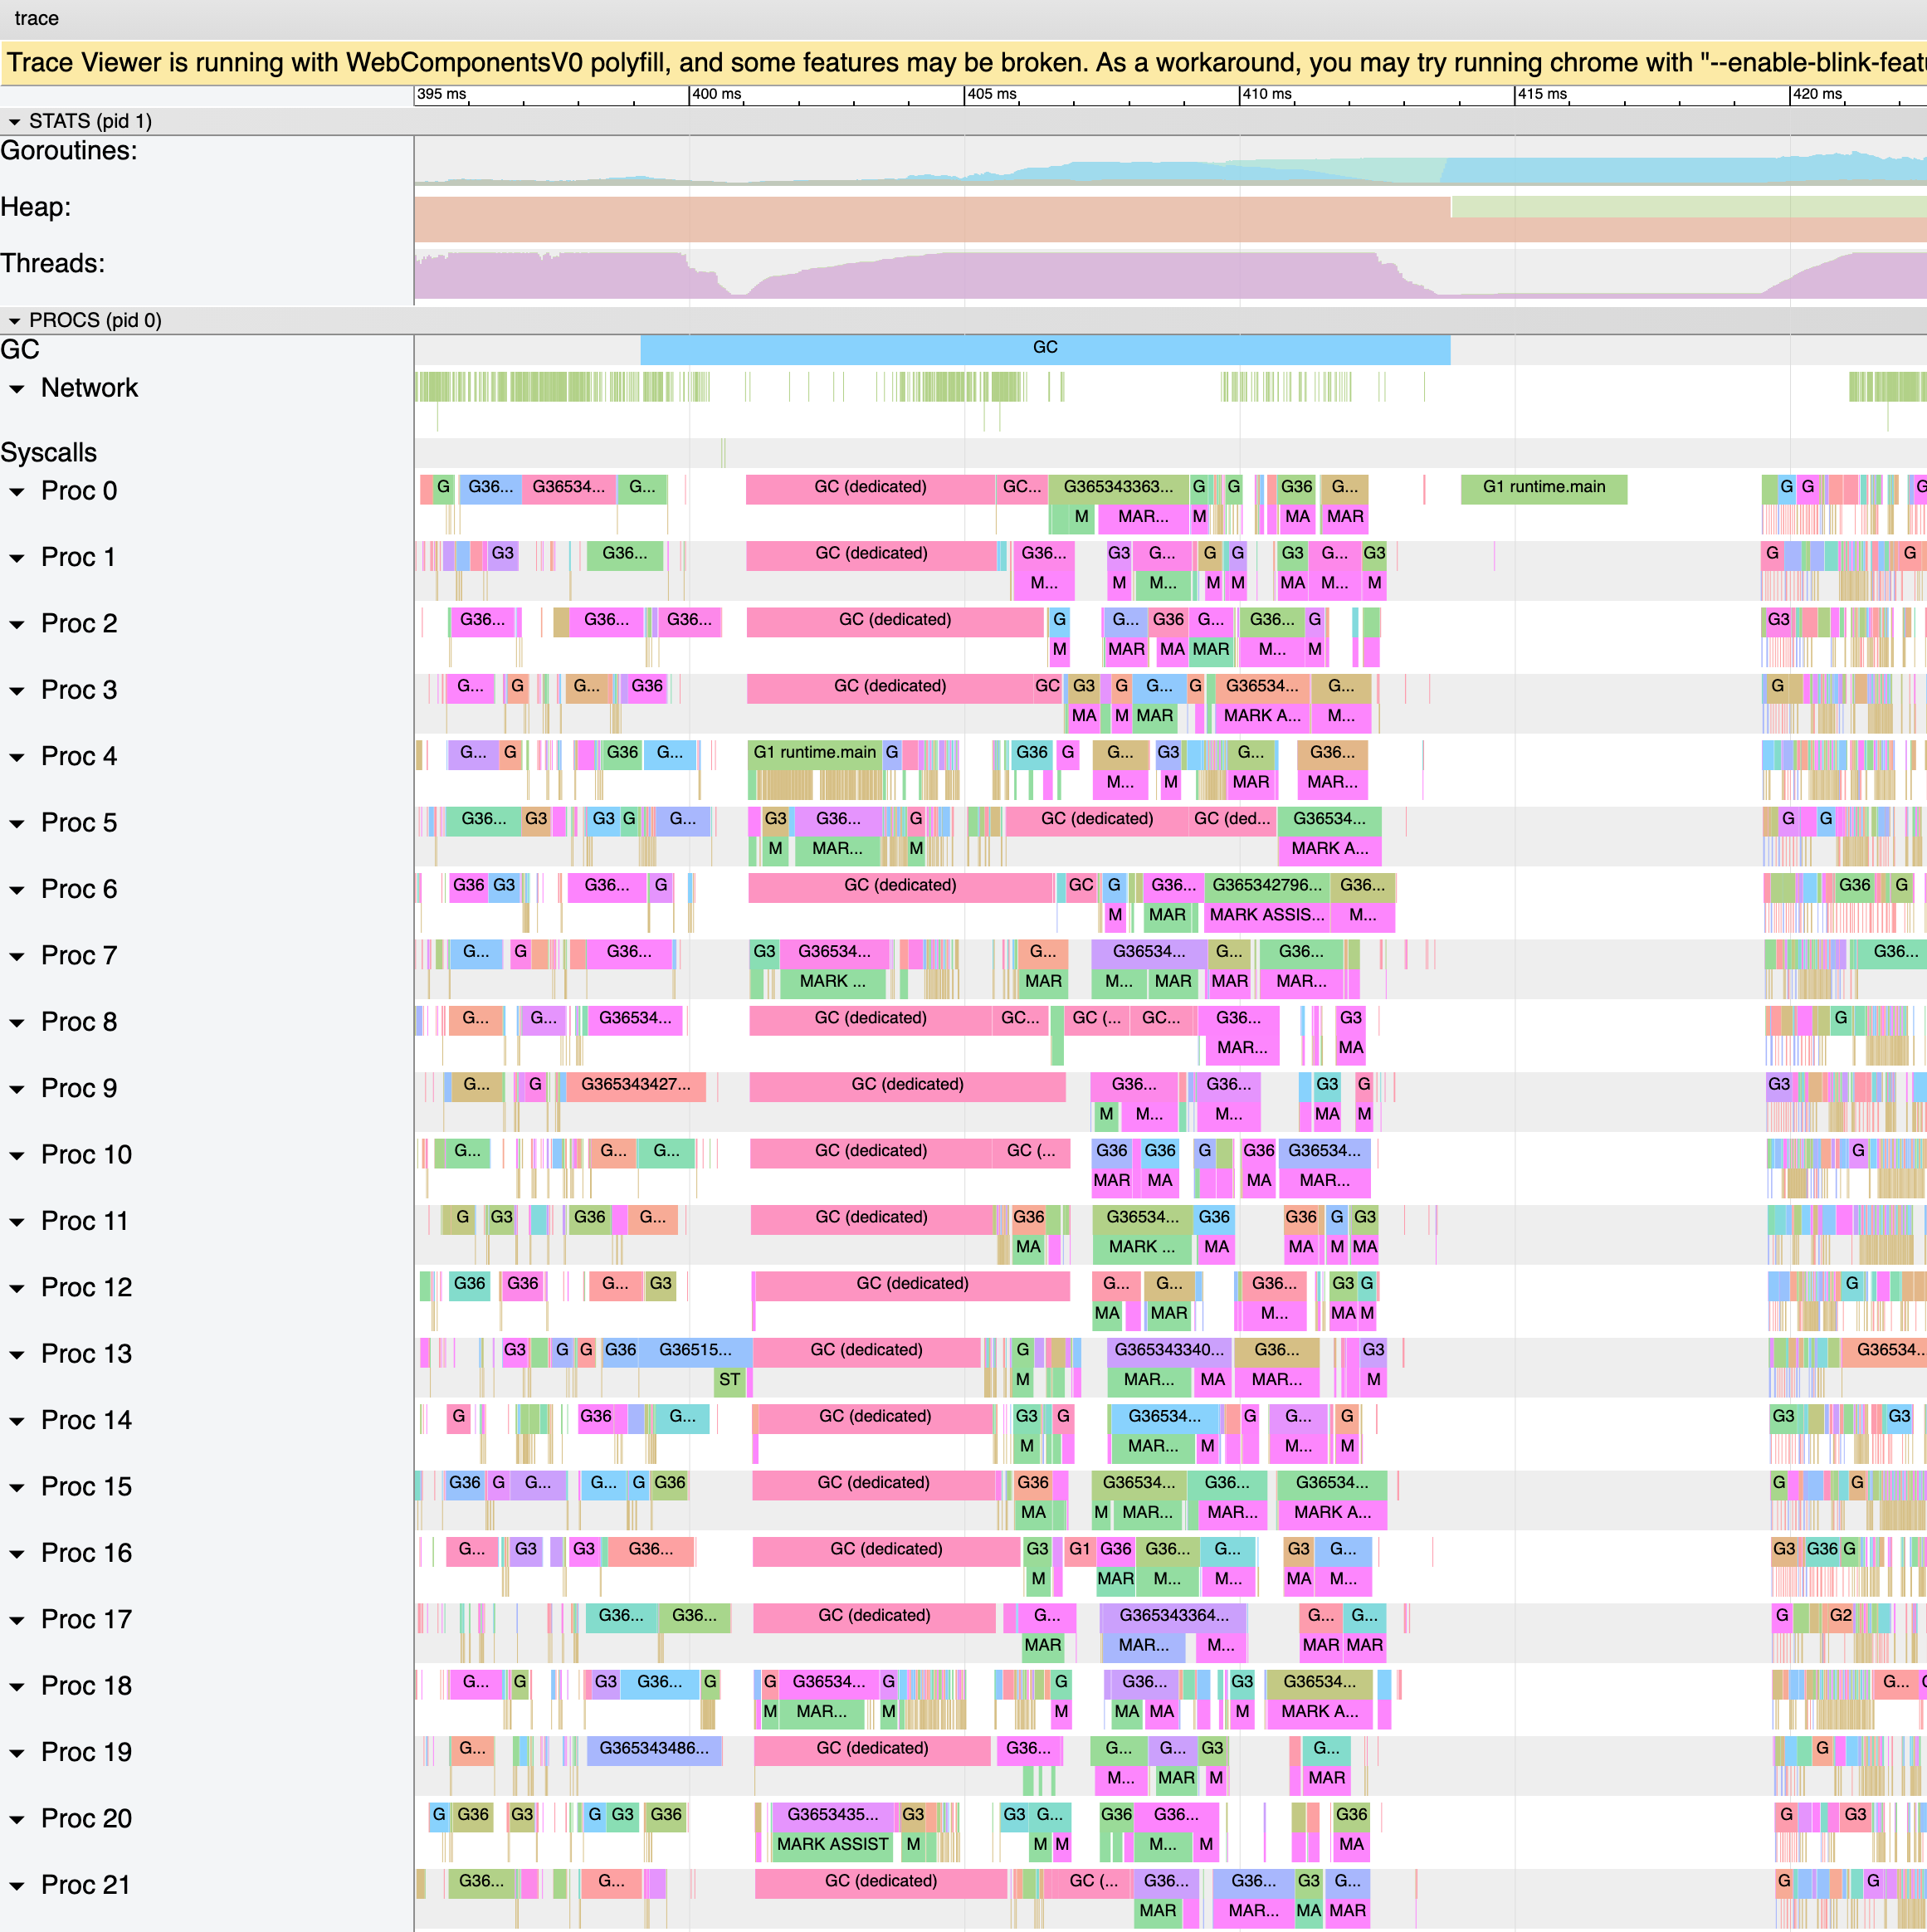
I've included some screenshots from go tool trace and contiguous section of the output of go tool trace -d below the fold, all from a single execution trace of the Go 1.15 app on a 96-hyperthread machine (during a load test, so it's especially busy). I'll walk through my understanding of how the events it shows line up with the code in runtime.gcMarkDone and its callees.
- At 413.835212ms on P 43, the GCDone event comes from
runtime.gcMarkTermination, https://github.com/golang/go/blob/go1.15.6/src/runtime/mgc.go#L1691 - At 413.924727ms on P 43, the GCSTWDone event comes from
runtime.startTheWorldWithSema, called fromruntime.gcMarkTermination, https://github.com/golang/go/blob/go1.15.6/src/runtime/mgc.go#L1752 - At 414.023884ms on P 0, the ProcStart event is the beginning of the app getting back to work. There are many attempts to get threads back to work -- in startTheWorldWithSema, in injectglist, etc. -- so I'd expect about every P is already eligible to run.
- At 414.028108ms on P 0, the GoStart event means the P is running real Go code, for goroutine 1. Lucky!
- At 414.622347ms on P 1, the ProcStart event attempts to get some work
- At 417.049823ms on P 0, the GoPreempt would probably come from
runtime.forEachP(probably a delayed acknowledgement of the first attempt, https://github.com/golang/go/blob/go1.15.6/src/runtime/proc.go#L1333) - At 419.467080ms, P 1 finally starts a goroutine, 4.844733ms after its ProcStart event and 5.438972ms after P 0's GoStart. The GCMarkAssistDone event right after suggests that the goroutine would have been on the global run queue.
- At 419.475251ms, P 62 starts a goroutine, only 0.008171ms (8µs) after P 1's first GoStart.
- At 419.478259ms, P 2 starts a goroutine, only 0.003008ms (3µs) after P 62's GoStart.
What I see in the perf profiles (collected with -T for timestamps, -g for full call stacks, and -F 997 for about 1ms per sample) is that the process does very little work at times (only one or two CPUs worth of samples, rather than dozens), and when I see what work it's doing during those times it is inside calls from runtime.gcMarkDone to runtime.systemstack to runtime.gcMarkTermination.func4 to runtime.forEachP for several samples in a row.
413784823 GoUnblock p=43 g=3653436610 off=7142743 g=3653434585 seq=6
413832289 HeapAlloc p=43 g=3653436610 off=7142755 mem=21571879176
413832801 GoUnblock p=43 g=3653436610 off=7142763 g=3 seq=32967
413835212 GCDone p=43 g=0 off=7142771
413835361 HeapGoal p=43 g=3653436610 off=7142773 mem=43143758352
413840844 Gomaxprocs p=43 g=3653436610 off=7142781 procs=96
413924727 GCSTWDone p=43 g=0 off=7142787
414023884 ProcStart p=0 g=0 off=6440481 thread=50
414028108 GoStart p=0 g=1 off=6440486 g=1 seq=50
414029516 HeapAlloc p=0 g=1 off=6440491 mem=21571885928
414622347 ProcStart p=1 g=0 off=9652526 thread=123
414690699 ProcStart p=62 g=0 off=7722494 thread=120
417049823 GoPreempt p=0 g=1 off=6440498
419467080 GoStart p=1 g=3653436412 off=9652531 g=3653436412 seq=5
419467550 GCMarkAssistDone p=1 g=3653436412 off=9652541
419468531 HeapAlloc p=1 g=3653436412 off=9652543 mem=21571892712
419470622 HeapAlloc p=1 g=3653436412 off=9652550 mem=21571899624
419472328 ProcStart p=2 g=0 off=9587511 thread=117
419472478 GoEnd p=1 g=3653436412 off=9652557
419474014 GoStart p=1 g=3653436380 off=9652559 g=3653436380 seq=3
419474270 GCMarkAssistDone p=1 g=3653436380 off=9652567
419474782 HeapAlloc p=1 g=3653436380 off=9652569 mem=21571906088
419475251 GoStart p=62 g=3653434994 off=7722499 g=3653434994 seq=0
419476488 HeapAlloc p=1 g=3653436380 off=9652576 mem=21571912456
419477342 GoUnblock p=62 g=3653434994 off=7722508 g=3653435051 seq=2
419477726 HeapAlloc p=1 g=3653436380 off=9652583 mem=21571917832
419478259 GoStart p=2 g=3653434087 off=9587516 g=3653434087 seq=7
419478835 GCMarkAssistDone p=2 g=3653434087 off=9587525